It is a commonly accepted truth on Wall Street that stocks fall 3 times faster than they rise. The typical explanation borrows heavily from psychology and assumes fear of loss is greater than desire for gain. Investors will flee en masse when their profits are at risk, but are more timid when it comes to buying into a market. Short sellers who espouse these principles point to the great stock market crashes of the 21st century to illustrate their points.
Figure 1 below shows a chart of the SPDR S&P 500 Trust (NYSEARCA:SPY) from March 9, 2003 through March 9, 2009 when the stock market finally bottomed after the Great Recession.
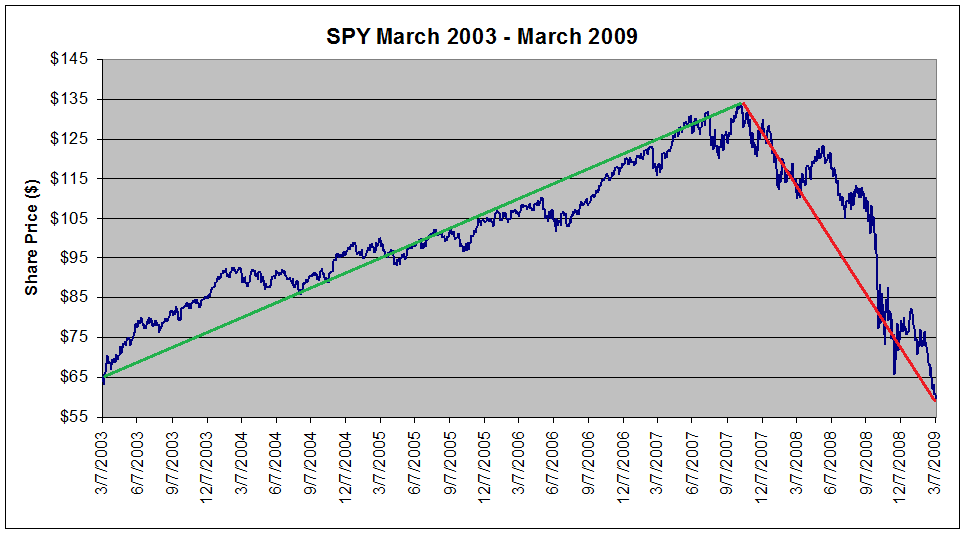
Figure 1: SPY performance from March 2003 to March 2009 suggesting showing rate of decline > rate of advancement. [Source: Yahoo Finance]
From March 9, 2003 to October 16, 2007, a period of 1682 trading days, SPY rallied from $63.85 to $131.31, a gain of 106%. From October 16, 2007 to March 9, 2009, a period of just 510 trading days, SPY gave all of those gains back, and then some, falling to $59.90. Thus, it took SPY 1682 days to gain 67 points, but just 510--or less than one-third the time--to lose the same amount.
Fast-forwarding 2 years, Figure 2 below shows SPY from October 3, 2010 to October 3, 2011 during the period of the European Crisis.
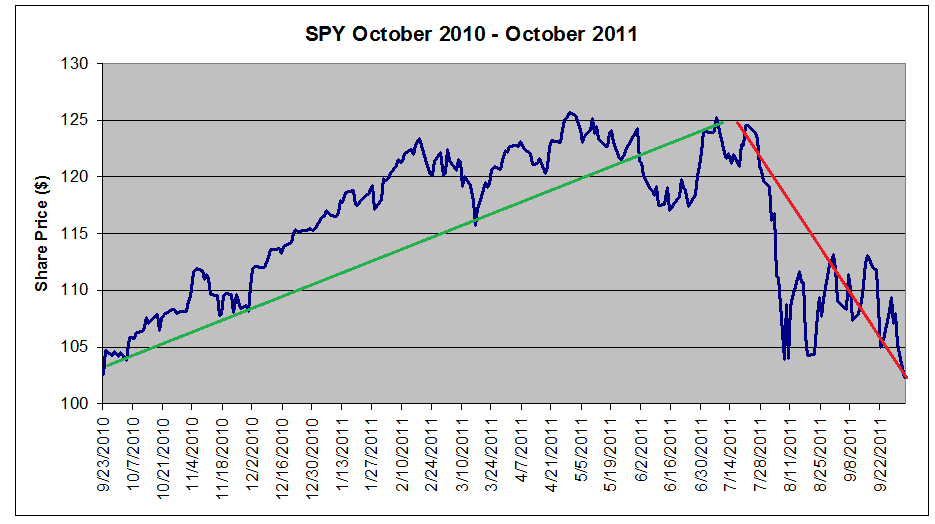
Figure 2: SPY performance from October 2010 to October 2011 against showing the rate of decline to be greater than the rate of advancement. [Source: Yahoo Finance]
Again, we see that in the same period that it took to gain 22 points--277 days--it took just 88 days or 32% of the time to shed those gains.
These two charts suggest anecdotally that the market does appear to fall much more