Recession Redux? Reading The Tea Leaves

Summary

  • We review key macro and markets-based recession indicators.
  • While the overall likelihood of a recession is small, we think the volatility cycle has turned.
  • Broad asset classes will see wider range-trading over the coming quarters and we advocate caution.

A few days after the US election, we reviewed the spike in uncertainty metrics and their link to the real economy and markets. Our conclusion was that, overall, the positive impulse from some of the advertised policies of the new administration were sufficient to overcome that hit from the spike in uncertainty, at least in the short term.

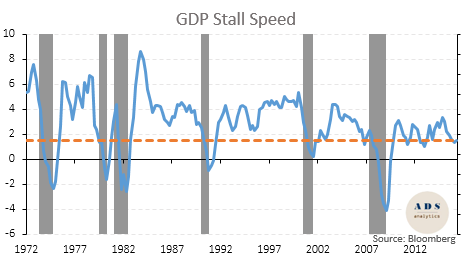
In this article, we dig a little deeper and review what the data and markets are telling us as far as the likelihood of a recession. While risk indicators have been relatively bullish, the macro situation overall is not as rosy as some of the markets would indicate. In particular, we remain concerned about the so-called "stall speed" (see below) of the US economy - GDP growth below which the likelihood of a recession increases substantially.
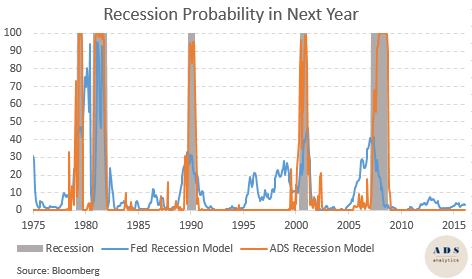
Moving top-down - our first port of call is the recession probability indicator. We show two versions of this indicator both of which rely on macro data: The one published by the Fed as well as our own. The Fed model is more sensitive though it has a longer lead-in time. Both models are flashing green at the moment with very low probabilities of a recession in the coming year.
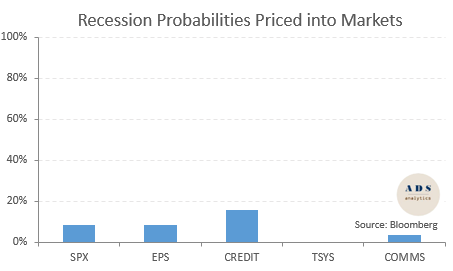
Our second set of indicators are market-implied probabilities of recession which are measured either as peak-to-trough changes in prices or the average of prices in recessionary and non-recessionary periods. Apart from a blip in the credit markets (which are well off historic market tights), the other indicators are very benign.
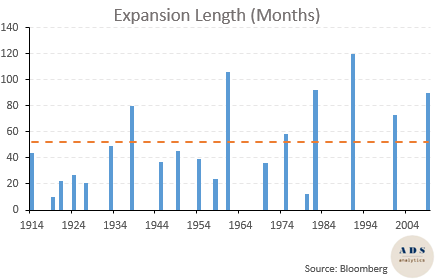
Finally, we put the length of the current expansion in context. While the current expansion is well above the historic average, it is not at an extraordinary level. In fact, three of the previous cycles since the 1960s have been longer.
So, what does all of this

This article was written by

ADS Analytics profile picture
12.42K Followers

ADS Analytics is a team of analysts with experience in research and trading departments at several industry-leading global investment banks. They focus on generating income ideas from a range of security types including: CEFs, ETFs and mutual funds, BDCs as well as individual preferred stocks and baby bonds.

ADS Analytics runs the investing group Systematic Income which features 3 different portfolios for a range of yield targets as well interactive tools for investors, daily updates and a vibrant community.

Analyst’s Disclosure: I/we have no positions in any stocks mentioned, and no plans to initiate any positions within the next 72 hours. I wrote this article myself, and it expresses my own opinions. I am not receiving compensation for it (other than from Seeking Alpha). I have no business relationship with any company whose stock is mentioned in this article.

Seeking Alpha's Disclosure: Past performance is no guarantee of future results. No recommendation or advice is being given as to whether any investment is suitable for a particular investor. Any views or opinions expressed above may not reflect those of Seeking Alpha as a whole. Seeking Alpha is not a licensed securities dealer, broker or US investment adviser or investment bank. Our analysts are third party authors that include both professional investors and individual investors who may not be licensed or certified by any institute or regulatory body.

Recommended For You

About DIA ETF

SymbolLast Price% Chg
Expense Ratio
Div Frequency
Div Rate
Yield
Assets (AUM)
Compare to Peers

More on DIA

Related Stocks

SymbolLast Price% Chg
QQQ
--
SPY
--
DIA
--
IWM
--
SPYG
--
SPYV
--
SPYB
--
SPYD
--