Costco: Potential Catalysts

Summary

  • Costco's business model is based on high membership retention, building incremental revenue from existing stores, and driving faster growth with strategic expansions to new locations, while lowering expenses.
  • Revenue growth is influenced heavily by forex fluctuations because of the overseas market expansion. Gasoline sales and USD strength/weakness could be the X factor in moving sales growth.
  • Hopes of gasoline price increase, forex turnaround, and the prospect of a membership fee increase appear to be pushing up the PE ratio of the stock.
  • PE ratio suggests most of the positives baked into price. Stock is likely to trade range bound during 2017, providing opportunities for short-term traders.
  • For long-term traders, it may take beyond 2017 to realize greater gains as Costco consolidates its current position. Membership fee increase may change that.

The past year has been brutal for most brick-and-mortar retailers. The U.S. Department of Commerce estimates that for the third quarter of 2016, e-commerce as a percent of total retail sales accounted for 8.4 percent of total sales. This represented a growth of about 4 percent from the previous quarter. There is no hiding from the fact that online sales have been a headwind for these traditional retailers. The net sales and profitability of these retailers have taken a hit as a result.

Costco (NASDAQ:COST), which falls under the brick-and-mortar retailers category, on the other hand, has managed to remain an exception to the norm. From fiscal year 2010 to 2014, Costco delivered an annualized net sales growth of 11.5 percent, handily beating other retailers in terms of growth. However, net sales have shown slower growth during fiscal years 2015 and 2016. So, the question is, has Costco reached a plateau? Or is this just a period of consolidation before a return to impressive growth? To answer this, a basic understanding of the strengths and weaknesses of the company is required. But first, let's take a historical view of the company's performance.

1. Costco's Impressive Growth History

Figure 1 shows the total revenue change YoY (includes net sales and membership revenue) and earnings before income tax (EBIT) change YoY.

YoY Revenue and Operating Income Change

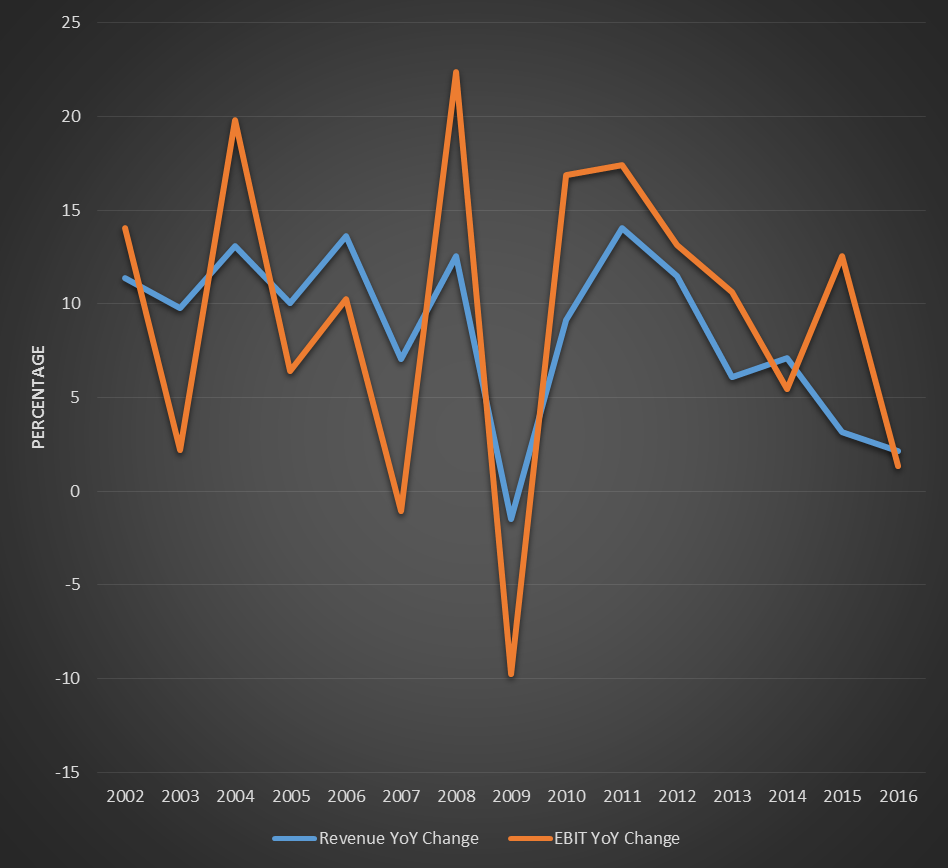
Figure 1: YoY Revenue and Operating Income Change. (Data taken from annual Costco 10-K filings)

Costco has a good history of providing solid revenue growth. Negative sales growth was seen only during fiscal=year 2009. However, growth promptly returned to the high-single digits during fiscal year 2010 once the economic conditions improved. Additionally, operating income has shown similar growth trends to revenue growth. There have been only two instances of negative operating income growth; during 2007 and 2009. However, Costco overcame these struggles to deliver solid sales growth

This article was written by

Predominantly a catalyst based trader. I look for events that have an opportunity to influence big moves and position accordingly based on available information. Asymmetric risk/reward ratio preferred.

Analyst’s Disclosure: I/we have no positions in any stocks mentioned, and no plans to initiate any positions within the next 72 hours. I wrote this article myself, and it expresses my own opinions. I am not receiving compensation for it (other than from Seeking Alpha). I have no business relationship with any company whose stock is mentioned in this article.

Seeking Alpha's Disclosure: Past performance is no guarantee of future results. No recommendation or advice is being given as to whether any investment is suitable for a particular investor. Any views or opinions expressed above may not reflect those of Seeking Alpha as a whole. Seeking Alpha is not a licensed securities dealer, broker or US investment adviser or investment bank. Our analysts are third party authors that include both professional investors and individual investors who may not be licensed or certified by any institute or regulatory body.

Recommended For You

About COST Stock

SymbolLast Price% Chg
Market Cap
PE
Yield
Rev Growth (YoY)
Short Interest
Prev. Close
Compare to Peers

More on COST

Related Stocks

SymbolLast Price% Chg
COST
--