I have already mentioned that holding physical gold is really a form of investing, and have also given some insight into why gold accumulates value. Now I want to go further.
Overview
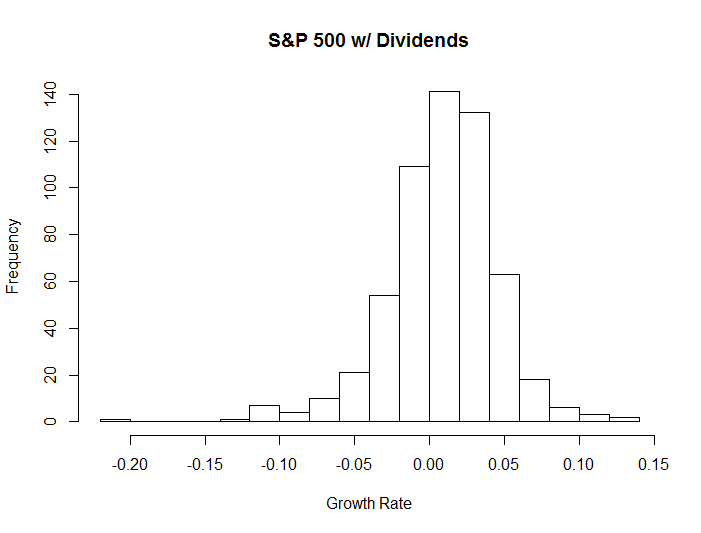
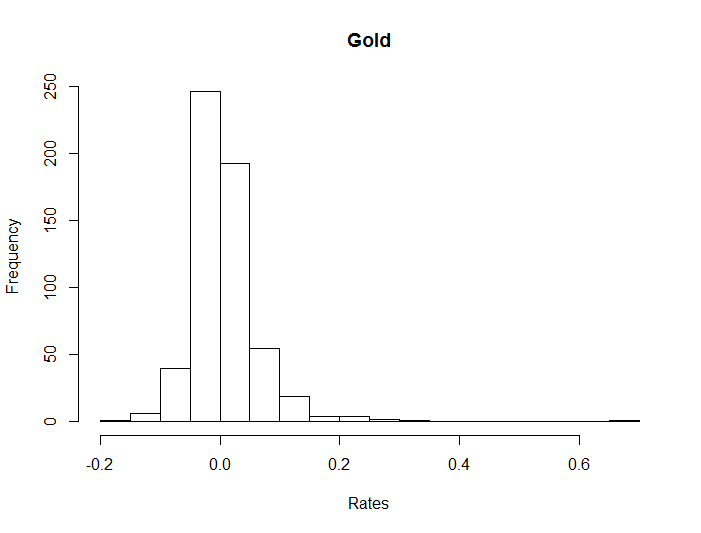
It is useful to compare the growth rates of both the S&P 500 and gold over a long period of time. But simply looking at average growth rates is not enough. This is because growth isn't necessarily distributed in a simple fashion. Consider the monthly growth rates for the S&P 500 and gold between April 1968 and December 2015. The mean growth rate for the S&P 500 was 0.85%, including dividends, while the mean growth rate for gold was 0.74% (both month over month).
The reason I am using month-over-month figures, rather than year-over-year figures, is because I have monthly price data for gold available by month. This gives a better resolution for a potential model. I could, of course, cite everything in YoY equivalents, but since the model is set up to compute values in monthly increments, I decided to leave things as is.
Histograms
Yet if we look at the histograms for these growth rates, we see things are far more complicated.
Prelims
Most people are familiar with the normal distribution. It is symmetric about the mean and has a rounded top. Not every probability distribution is so nice however.
To handle more distributions, there are two values, in addition to mean and standard deviation/variance that are available. They are "skew" and "kurtosis."
Skew is not all that difficult to understand. Essentially, if more of the data points are to the left of the mean than to the right of it, then the distribution is left, or positive, skewed. If more data points fall to the right of the mean than to the left, then the distribution is left, or negative, skewed.