Vanguard Wellesley Income: Buy And Hold Forever

Dave Dierking, CFA
5.95K Followers

Summary

  • Some really good actively managed funds are being overshadowed in the current index fund craze.
  • Vanguard Wellesley Income is a nearly 50-year old fund with a stellar track record of delivering shareholders strong returns while limiting downside risk.
  • This fund may particularly appear to retirees given its 3% dividend yield and its history of limiting shareholder losses in down markets.

With so much attention focused on the billions and billions of dollars flowing into passively managed index ETFs, you might be surprised to find that actively managed mutual funds still exist! But they do, although the reasons that this segment of the market is shrinking are easy to understand.

For most funds, the cost of active management continues to be prohibitive. The average expense ratio for an actively management large cap mutual fund is around 1.25%. The average for an S&P 500 index fund? About 0.15%. That difference of over 100 basis points annually combined with the difficulty of trying to consistently pick outperformers over time has proven a steep hill to climb. Roughly 80% of active funds fail to match their benchmarks over time.

But not all active funds should be kicked to the curb. Some funds have great long-term track records, low expenses and smartly managed portfolios. At Vanguard, one of their oldest funds is also one of their best.

The Vanguard Wellesley Income Fund (MUTF:VWINX) is a nearly 50-year old fund that maintains a balance of around 60-65% bonds and 35-40% stocks. The mix of investment grade bonds and large-cap stocks makes it an ideal choice for retirees, those planning for retirement or new investors right out of the gate.

The fund's ability to limit shareholder risk while delivering above average returns in the process has been perhaps its greatest asset. There are a couple of graphics that I like to use when detailing Wellesley's historical returns and risk.

VWINX Total Return Price Chart

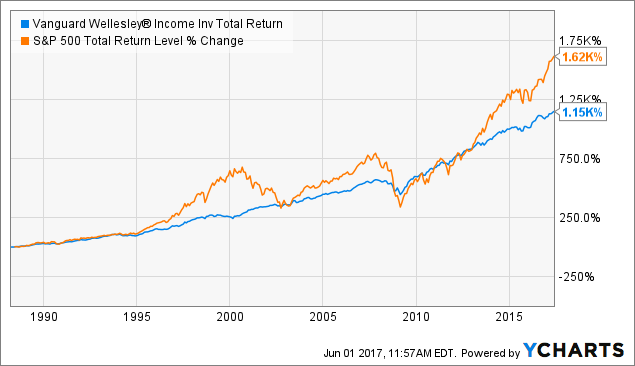
VWINX Total Return Price data by YCharts

The goal of this chart isn't to point out that the fund has underperformed the S&P 500 over time (nor should it be expected to given the unfair comparison of a 100% stock index against a balanced fund). It's to illustrate how the fund

This article was written by

5.95K Followers
Freelance writer focused on ETFs, portfolio management and macro.To receive notifications of new articles and blog posts as soon as they're published, click on the orange Follow button and become a real-time follower.

Analyst’s Disclosure:I/we have no positions in any stocks mentioned, and no plans to initiate any positions within the next 72 hours. I wrote this article myself, and it expresses my own opinions. I am not receiving compensation for it (other than from Seeking Alpha). I have no business relationship with any company whose stock is mentioned in this article.

Seeking Alpha's Disclosure: Past performance is no guarantee of future results. No recommendation or advice is being given as to whether any investment is suitable for a particular investor. Any views or opinions expressed above may not reflect those of Seeking Alpha as a whole. Seeking Alpha is not a licensed securities dealer, broker or US investment adviser or investment bank. Our analysts are third party authors that include both professional investors and individual investors who may not be licensed or certified by any institute or regulatory body.

Recommended For You

About VWINX Ticker

SymbolLast Price% Chg
Expense Ratio
Div Frequency
Div Rate
Yield
Assets (AUM)
Compare to Peers

More on VWINX

Related Stocks

SymbolLast Price% Chg
VWINX
--
VWELX
--