When we last looked at Masimo Corporation (NASDAQ:MASI) back on May 9th, it had just dropped steeply after the release of its first quarter earnings report. Since then it ran back up during June and July, but just dropped strongly again after reporting its second quarter earnings. One has to wonder if this is the start of a top and a stronger move down for MASI. A thorough analysis of the charts and last earnings report can tell us what to expect though.
Masimo Develops Noninvasive Biomedical Sensors
First, a quick refresher about what Masimo does. Masimo develops and manufactures biomedical sensors for hospitals and other medical facilities. It specializes in non-invasive sensors, like monitors for hemoglobin. The company also makes gas detectors and brain monitors. This should be a growing field thanks to our aging population and the growing need for better medical sensors. Accurate noninvasive monitors are also in high demand. Congress’ healthcare antics have been a drag on the entire biotech field though. So that’s unfortunately held back some biotech companies like Masimo.
Masimo is Showing Signs of a Top
Now let’s see how MASI has performed since its last earnings report in May. A monthly chart shows that MASI slowly rose after the May drop to form a lower high. Then it fell strongly again in August. Volume has also been quickly declining. Overall, this looks like a weak pattern, and the chart shows that MASI is in danger of forming a double or “M” top.
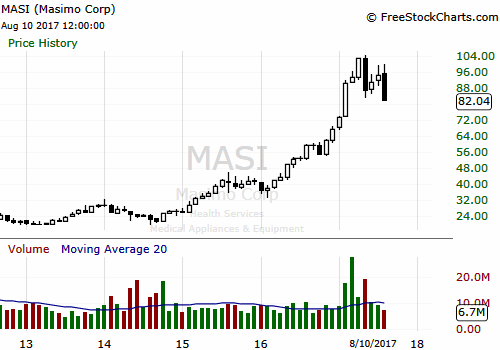
Figure 1: Monthly chart of MASI. Chart provided by FreeStockCharts.com.
The weekly chart gives us a closer look at the more recent price action. After the big drop in May, MASI started to recover. The candles that formed in most recent uptrend looked smaller and weaker though, with more wicks and tails. Then in July, larger and more numerous black candles started to show up. This shows that the upside momentum was weakening. Volume was also lower during the run. Volume was mostly green during the start of the most recent uptrend, but more red volume started showing up a few weeks ago. The weak volume wasn’t a good sign since increasing volume is needed to support the stock’s climb. So the trend was weakening prior to the big drop in August.
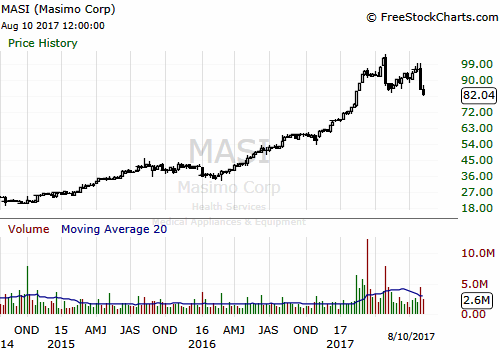
Figure 2: Weekly chart of MASI. Chart provided by FreeStockCharts.com.
Then on 8/3/17, MASI once again formed a huge black candle as it plummeted towards the May lows. This one-day drop is seen very clearly in a daily chart, shown in Figure 3. The drop once again comes after MASI released its earnings report. This is the second quarter in a row that this has happened.
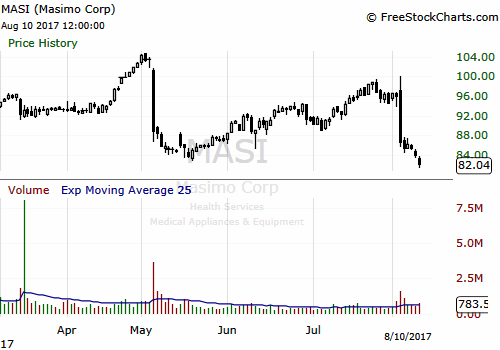
Figure 3: Daily Chart of MASI. Chart provided by FreeStockCharts.com.
It’s also the second quarter in a row that high frequency traders likely instigated a move down. A ten-minute chart from 8/3/17 shows a classic high frequency trader footprint. The average volume on ten-minute candles for the past few weeks was about 20,000, give or take. But volume in the first few minutes of 8/3/17 skyrocketed to almost 248,000, a ten-fold increase! High frequency traders are almost always responsible this sort of volume surge. This action drove MASI's price down about $20 in the space of just a few minutes. MASI’s been languishing near the lows of May since then.
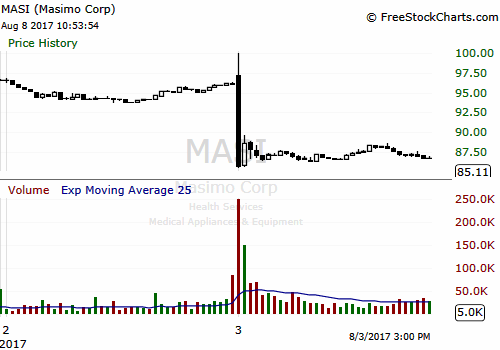
Figure 4: Ten-minute chart of MASI from 8/3/17. Chart provided by FreeStockCharts.com.
Volume hasn’t been all that great on the daily chart either. It really dropped during June and July. The stock needed stronger volume to continue to drive it up past the May highs.
MASI’s indicators also confirm what we see in the candlestick charts. Relative Strength Index rose during June-July as MASI began to recover from the May drop. But then, it started to weaken and decline even before MASI plummeted. This was a warning sign. Stochastics made a lower high and is now moving towards the oversold line. There are no signs of it turning yet.
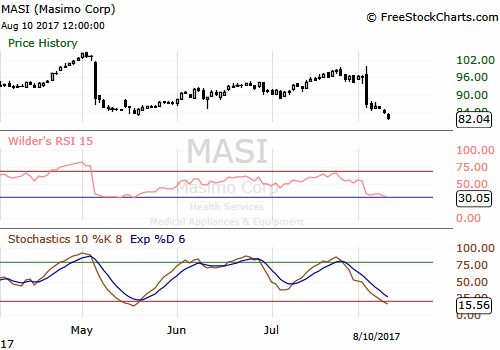
Figure 5: Indicator charts for MASI. Chart provided by FreeStockCharts.com.
Masi’s sudden drop left it somewhat oversold. So it wouldn't be a surprise if it bounces weakly or moves sideways in the near term. But the combination of the lower high and low volume is troubling. That leaves MASI at risk for a top. The top would complete if MASI falls and sustains below $82. Then it would be at greater risk of falling much further. What isn’t clear from the charts though is why MASI fell so badly on 8/3/17. It’s pretty obvious that the drop was related to the 8/2/17 earnings release. So perhaps that report will have some clues.
Masimo Beat Second Quarter Estimates, But Could Slow Down
On 8/2/17, Masimo reported revenues of $192.9 million, which was an increase quarter over quarter and beat analysts’ estimates of $188.6 million. The company reported earnings per share of $0.83, which was a slight increase over last quarter and exceeded analysts’ estimates of $0.71. Masimo didn’t report any new long-term debt. So far the report is very positive, and there isn’t a smoking gun to explain why its stock dropped so sharply.

Figure 6: Income Statement for MASI. Data provided by Google Finance.
We should also check the guidance and see if that caused the negative reaction on 8/3/17. Masimo actually raised its guidance for the year. The company raised its revenue guidance from $759 million to $769 million. Masimo also expects earnings per share of around $2.8, up from $2.65. And CEO Joe Kiani was very upbeat about his company’s performance. He said,
Our second quarter results exceeded our expectations and continue to illustrate the strength in our business. I am very happy to be able to report that for the first time ever, excluding handheld and finger oximeters, we shipped 50,000 SET® Pulse Oximeters and rainbow SET™ Pulse CO-Oximeters in the quarter as we continue to see broad adoption of our products throughout the world. Our outlook for the remainder of 2017 remains strong and we are happy to be able to increase our financial guidance for fiscal 2017.
Masimo didn’t give any guidance for the third quarter, however. We can find analysts’ estimates on EarningsWhispers.com though. Currently, analysts expect Masimo to report revenues of $184 million and earnings per share of $0.52. The end of the third quarter is still a ways off though, so those numbers could change over the next few months. But right now it looks like revenues and earnings will drop off in the third quarter. Masimo needs to keep growing its financials quarter over quarter to stop its stock from topping. The company could surprise with better than expected numbers again though thanks to its improved guidance.
It doesn’t look like investment firms are dumping MASI in large amounts either. MASI had more institutions opening new positions than selling out. More firms also increased their holdings than decreased.

Figure 7: Institutional Holdings for MASI. Data provided by Nasdaq.com.
There are several giant institutional investors among the top holders including Vanguard, Dimensional Fund Advisors, and Northern Trust. Some of these firms added to their positions, so they seem to expect that MASI will continue to climb.

Figure 8: Top Institutional Holders for MASI. Data provided by Nasdaq.com.
Conclusion
MASI had another huge drop this month that was likely initiated by high frequency traders. The earnings report doesn’t seem to justify this large drop, however. It’s possible that the high frequency trader computers misunderstood the second quarter report and fired of trades in the wrong direction. It happens from time to time since high frequency trading computers can’t think or reason. Their selling could have then triggered stop losses, contributing to the downtrend. For now, MASI's price has stabilized. MASI’s still at a risk of forming a top though, and any surprise bad news could drive its price down further. And it can fall much further if the top completes and triggers more stop losses. It’s also possible that MASI will form a trading range. That would allow the stock to move sideways and pattern out its speculative gains from 2016 and earlier in the year. It looks like MASI’s revenues and earnings could drop next quarter though, so this probably isn’t a good time to enter a new position. Holder’s should be fine to continue to hold for now, but consider moving up stop losses to protect profits.