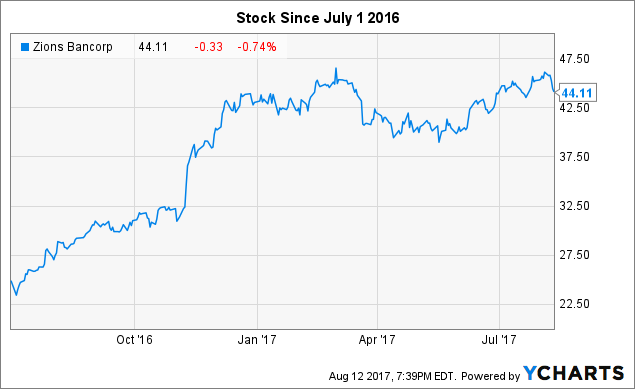
Zions Bancorporation (NASDAQ:ZION), like most banks, has had a huge run since July 2016. However, unlike most banks, the stock has adjusted very little from its yearly highs set in March.
In this two-article series, we'll look at the valuation of ZION to show that it appears the stock is currently overvalued, but in the second article will also look at the revenue stream to determine whether the bank has enough income to justify these high valuations.
In looking at valuations, we're going to do something different. In addition to analyzing the P/E of the stock, we're also going to correlate historical P/E to yields and price to determine how far off the bank stock is currently trading relative to the past.
We'll also compare ZION to their peers including KeyCorp (KEY), Huntington Bancshares Incorporated (HBAN), M&T Bank (MTB), Regions Financial Corporation (RF), and Fifth Third Bancorp (FITB).
The stock has surged riding the bank rally from July 2016
 ZION data by YCharts
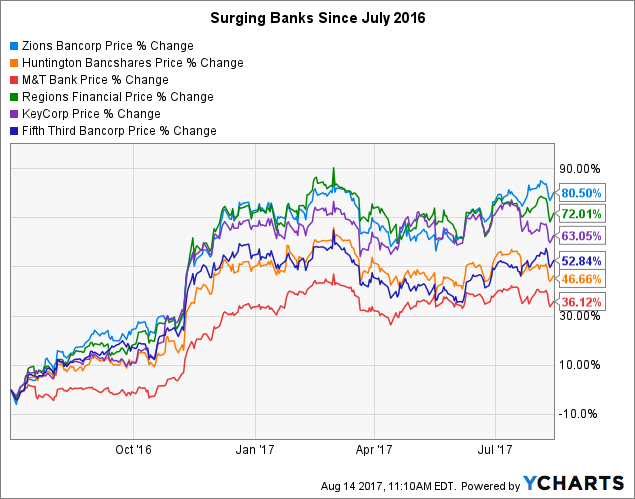
Zions' stock price has held up relative to its peers. The bulls remain in control of the stock.
The 80% run represents the market's view that ZION is a well-run bank with a lot of potential for growth in a rising yield, rising economic growth environment.
 ZION data by YCharts
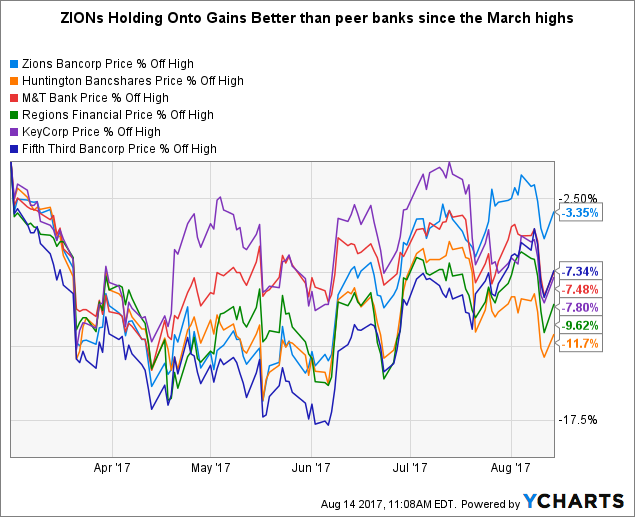
ZION has barely come off its highs from March (only 3.35%) this year as we'll see below has resulted in an elevated P/E relative to peer banks.
 ZION data by YCharts
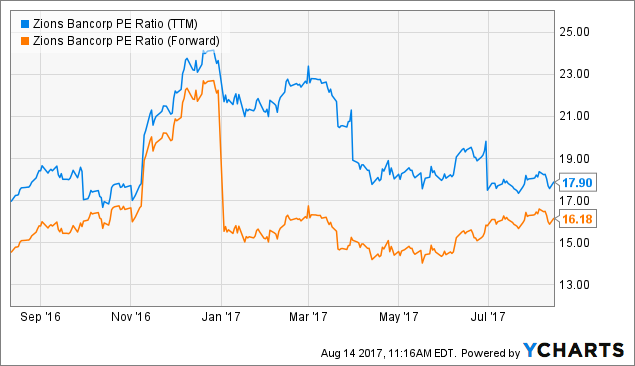
P/E Ratio Analysis:
The P/E ratio measures the current stock price to past quarterly earnings. The forward P/E ratio measures the current stock price to expected future earnings.
- A higher P/E means that the price is higher relative to the earnings and may indicate a stock is overvalued.
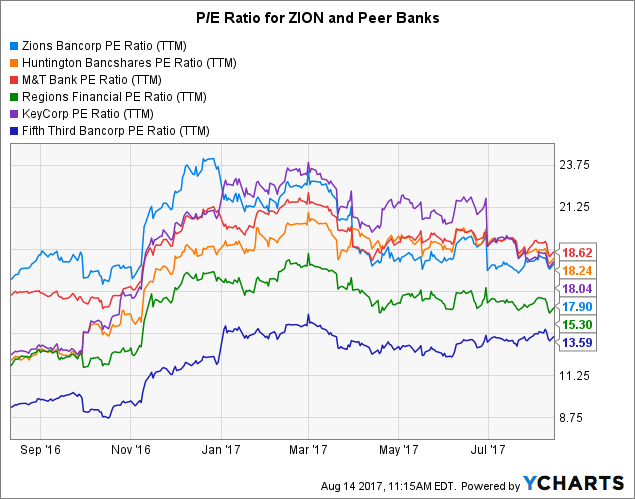
- The below chart shows a P/E ratio of 17.90 for Zion.
- The forward P/E is currently 16.18 for the bank.
 ZION PE Ratio (TTM) data by YCharts
P/E ratio compared to banks in the peer group:
- The P/E is fairly high at close to 18 and remains in the top tier of valuations for its peer banks.
- In fairness, regional banks typically have a higher than normal P/E. However given that larger bank's P/E's are hovering around 13, there may be a need for a further adjustment in the valuation of the bank.
 ZION PE Ratio (TTM) data by YCharts
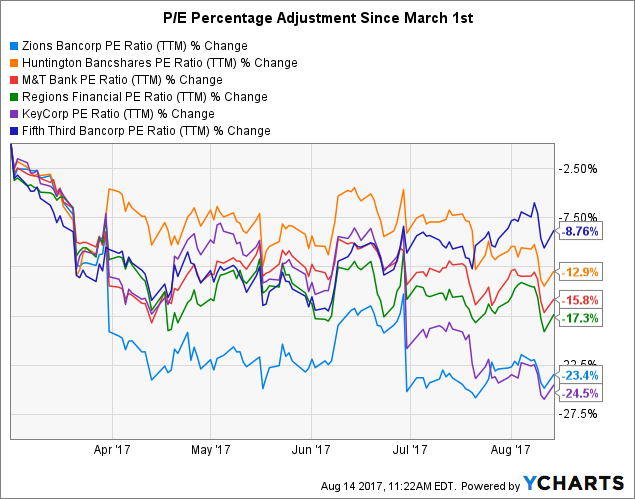
Percentage adjustment in valuation:
- Zions' P/E ratio has fallen over 23% since March 1st or before the first Fed hike of the year and the peak in the bank rally in early March.
- You might be thinking right now, wait a minute, Zions' P/E has come down by a greater percentage than most of the regionals in our peer group, and you'd be correct. However, ZIONs' P/E was close to 25 earlier this year, so the larger percentage drop is needed to bring the bank's valuation down to earth.
- It's true that the valuation adjustment puts Zions in a good position for any upcoming rally in bank stocks following positive economic developments or rising yields.
But I believe a larger correction is needed when we compare and correlate the P/E to historical yields.
 ZION PE Ratio (TTM) data by YCharts
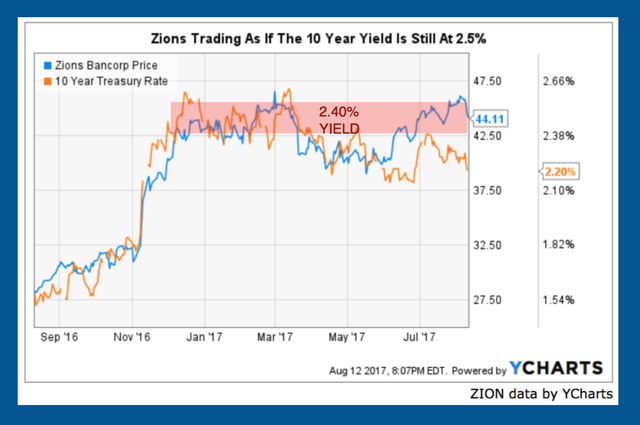
Why we could see an adjustment lower in stock price:
Since regional banks rely more heavily on lending out deposits for creating income than larger banks, the 10-year yield is extremely important for banks like Zions' profitability.
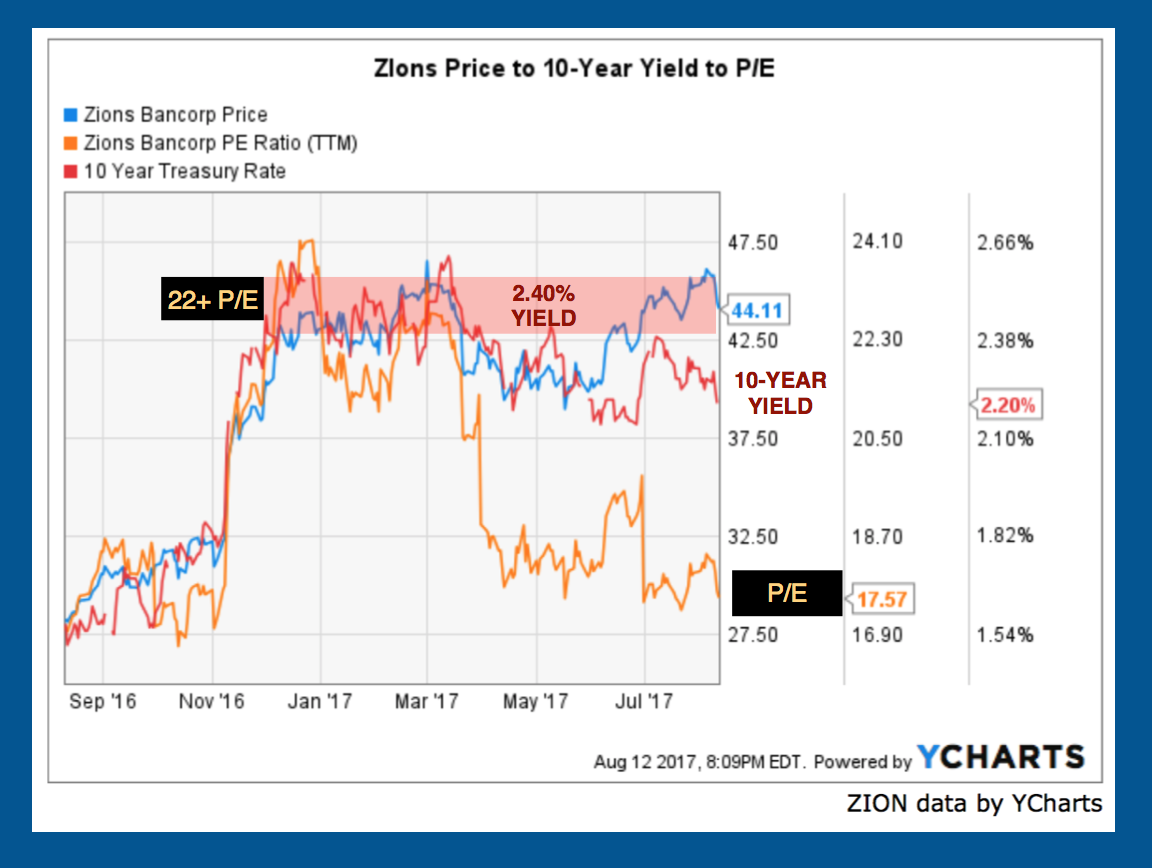
- If you correlate the 10-year yield with the stock, we see that currently Zions is trading at $44 and the last time the price was this high was in March of this year. The 10-year yield at the time was 2.4%.
- In other words, bank stocks took off based on expected future earnings and growth in loans and deposits.
- At 2.4% yield, the expectation in the market bid the stock up to $44 which means the market was bullish on its long-term view of the ZION, provided the yield was trading at 2.4%.
- Apparently, the bullish view remains since it remains at $44 while yields have corrected to 2.20%. However, I'm not sure how long the price can remain elevated in a lower yield market.
- At some point, the fundamentals must kick in whereby Zion need to earn increasing amounts of revenue due to higher economic growth and higher yields. Remember regional banks need higher yields more so than larger banks, because regionals don't typically have large pools of cash on their balance sheets earning income from investments and securities, nor do they have large amounts of non interest income to help weather a low yield storm.
- As a result, either yields must rise or the stock has to adjust lower at some point in the coming months; perhaps meeting at the half way point of $42.
 Further analysis as to why an adjustment in the stock may be necessary:
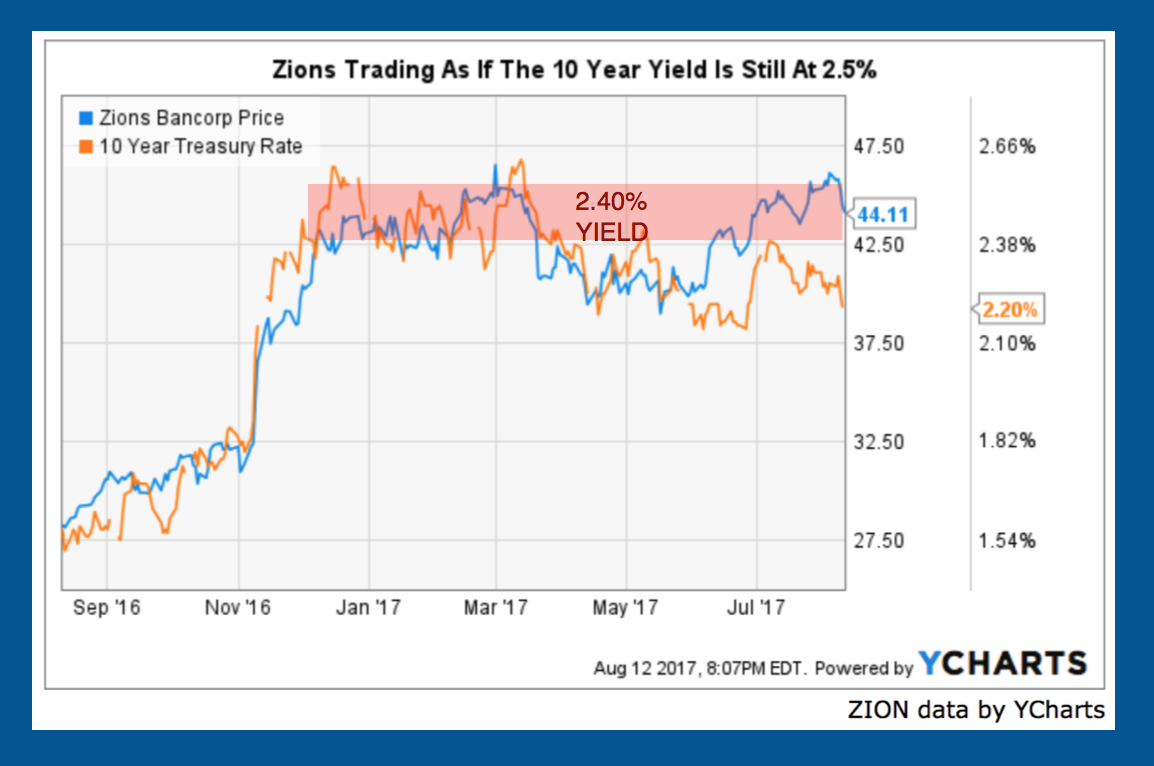
- In the chart below, I added the P/E to the historical correlation and we can see that the current price correlates not only to a 2.4% yield but also a 22 P/E. Although it's a welcome sign that the P/E has adjusted lower as yields have fallen, the stock price has barely moved.
- On the bottom of the chart, Zions' P/E reads 17.57 (bottom right-hand corner) from the highs of 22 earlier in the year.
- Also, if you look to the left of the chart (bottom left corner) the last time the P/E was at 17.57 was in November 2016 when the stock was trading at $30 and the 10-year was at 1.75%.
- It's unlikely yields will revisit 1.75% given the Fed hikes, the upcoming reductions in the Fed's balance sheet, and solid economic growth. As a result, it's more likely that Zions' stock price will come down.
- To put it another way, unless ZION puts up incredible revenue growth or yields rise to meet the stock price, it's a high probability that the lower 10-year yield and lower P/E will at some point drag down the stock price.
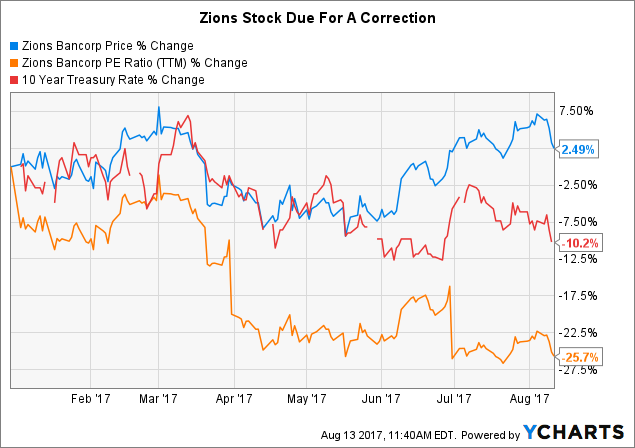
 Comparing the percentage drop in P/E, yields, and Zions stock:
- In the chart below, we see that Zions has only corrected 2.5% versus the 10% for the 10-year and the 25% for the bank's P/E.
- If current economic conditions continue (2.5% economic growth) and yields remain at these low levels, Zions looks overpriced and is likely to come down in the weeks ahead.
- Perhaps the stock retraces to the $40-$39 area to match the current 2.20% 10-year yield.
 ZION data by YCharts
Takeaways:
Don't get me wrong, I'm bullish on Zions and bank stocks in general since I believe economic growth is likely to rise, pushing up yields and bank stocks in the process.
In my opinion, a healthy correction would be good for the stock since it would allow long traders who have yet to get in, an opportunity to initiate positions and ride the next rally higher in bank stocks.
- Again, the above correlation analysis is only true if the current correlation between our three metrics continues in the coming months. If yields surge to catch up with and justify the higher stock price, Zions would probably correct very little, if at all. That's assuming economic and positive fundamental tailwinds are behind the push higher in yields.
- If the fundamental picture changes for the negative and we have an unlikely economic downturn, perhaps caused by geopolitical risk, bank stocks like Zions might correct even lower in that scenario.
- However, I believe the current valuation may be too rich. But a lot depends on loan, deposit and income growth in the coming quarters.
- In my second article for Zions, I analyze the growth rates of net interest income, loans and deposits and whether the bank has enough growth to justify the valuations. Undoubtedly, Treasury yields will play a huge role in any rise in net interest income and in the stock price in the coming months.
- If yields remain depressed for several weeks or months, it's unlikely Zions will be able to hold onto the current price levels.
- As a result, we may see traders selling into future rallies, especially if Treasury yields remain low and economic growth hovers near 2%.
Stay tuned for my second article in the coming days on Zions Bancorporation and don't forget to follow the instructions below to become a follower and receive the article emailed to you. Or if you prefer, you can await anxiously by your computer and refresh your screen every ten minutes until my next article is published.
Good luck out there.
Author's note: If you like this article and would like to receive email alerts to stay up to date on Bank of America, banks, equities, and commodities, please click my profile page, and click the "Follow" button next to my name, and check "Get email alerts" to receive these articles sent via email to your inbox.
You can also find the "Follow" button at the top of this article next to my name. And of course, feel free to comment below if you have any questions, or send me a private message by clicking the "send a message" link on my profile page.