In this brief note, I aim at exploring the behaviour of gold prices during the previous U.S. government shutdowns and debt ceiling crises to better examine the present fluctuations of gold prices ahead of the imminent deadline for the government shutdown and debt ceiling this year.
Gold’s reaction to past episodes of U.S. government shutdowns
Looking at gold's immediate price response following the 18 occasions of a government shutdown since 1976, I estimate that:
(1) On average, prices have risen a modest 0.1% on the first day of the shutdown. In the government shutdown of 2013, gold prices sold off 3.1% during the first day of the government shutdown - on October 1, 2013.
(2) On average, gold prices have fallen by 0.46% in the week before the shutdown. In 2013, gold prices were down 1.4% one week before the shutdown.
Gold’s reaction to past U.S. debt ceiling episodes
If we analyse the previous two debt ceiling crises (2011 and 2013), we note that the gold reaction was significantly different.
In the debt ceiling crisis of 2011, gold (NYSEARCA:NYSEARCA:GLD) rose by a whopping 12% from $1,486.50 on July 1, 2011 (one month before the U.S. debt ceiling deadline) to $1,665.60 on August 3, 2011 (the date when The Treasury increased the national debt by $238 billion).
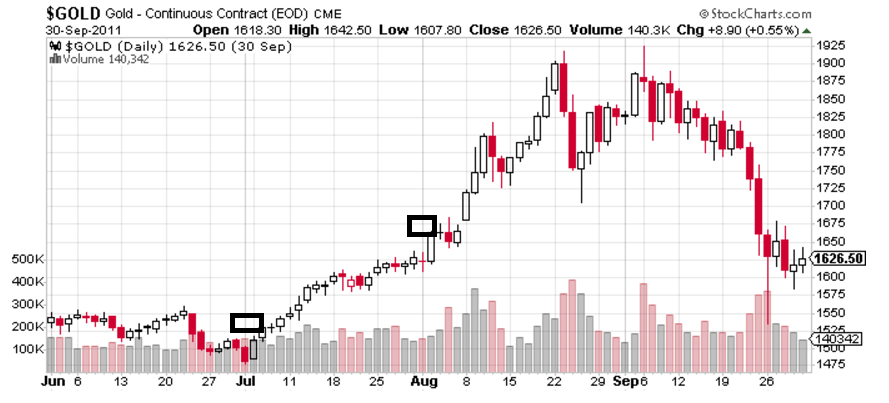
Source: StockCharts
In the debt ceiling crisis of 2013, gold rose less than 1% from $1,306.75 per oz on September 17, 2013 (one month before the debt ceiling debate) to $1,318.00 per oz October 17, 2013 (the date when the Senate passed a resolution to fund the government until January 2014 and suspend the debt ceiling until February 2014).
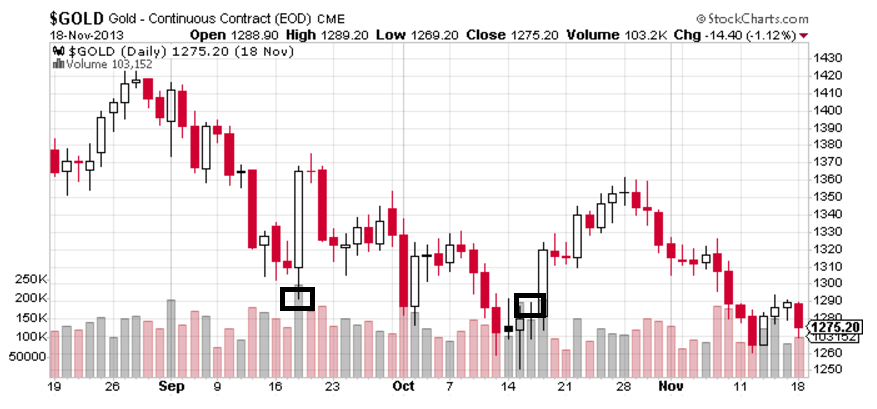
Source: StockCharts
The different behaviour of gold prices during the previous two debt ceiling crises was driven by a different investor attitude toward risk.
In 2011, market players were deeply worried about the debt ceiling crisis and a possible downgrade of the U.S. credit rating (which in fact occurred on August 6, 2011, when Standard & Poor's downgraded the US's AAA credit rating). There was, therefore, a strong need from investors to hedge their portfolios. Even more importantly, investors were concerned by the sovereign debt crisis in Europe which reached its climax in August. Gold was the only game in town at that time.
In 2013, market players were much less concerned by the political situation in the U.S. Even Standard & Poor's was confident that the debt limit would be increased on time and Standard & Poor's AA plus rating on U.S. debt was unlikely to change. As a result, contrary to 2011, investors did not need to build risk-unfriendly positions, leaving gold broadly flat.
The current situation
U.S. lawmakers will return from August recess on September 5. On the government shutdown, the federal government is funded through September 30, the end of the 2017 fiscal year. On the debt ceiling, the Treasury Department projects that the government will reach its debt limit as early as September 29, which is why Treasury Secretary Mnuchin urged the Congress earlier this summer to raise the debt ceiling before September 29 deadline.
As of August 30 (one month before the U.S. debt ceiling deadline/shutdown), gold closed at $1,308.45 per oz.
Whether gold will reacts a la 2011 (bull case) or a la 2013 (neutral case) remains to be seen.
My view
It seems to me that market players are not worried about a possible U.S. government shutdown/debt ceiling crisis, as evidenced by the low level of volatility across risk assets (eg VIX), the resilience of broad equities, and the relatively low level of U.S. credit default swaps relative to the previous political crises.

Source: Snake Hole Lounge.
Also, the significant damages caused by the floods from Tropical Storm Harvey will probably prompt the Congress to act wisely and rapidly to provide disaster relief funding to the affected areas, thereby reducing the odds of U.S. government shutdown.
As Goldman Sachs illustrates in the chart below, the Congress has always passed a legislation following previous major hurricanes.
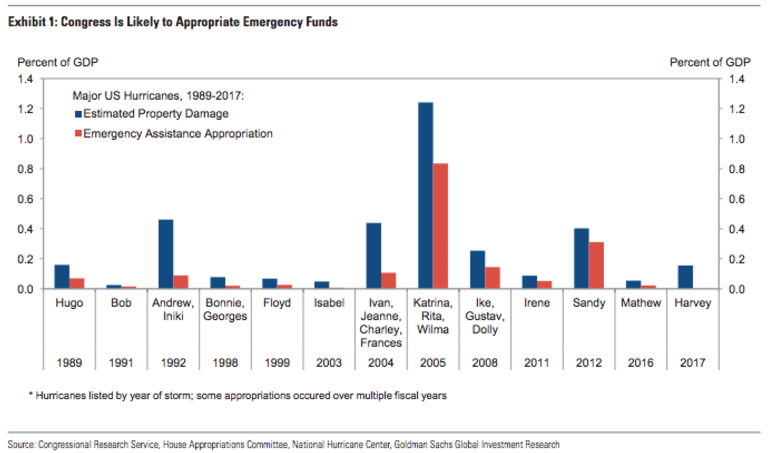
Source: Goldman Sachs.
In this case, the current debt ceiling episode looks like more than in 2013 than that in 2011. Thus, safe-haven bids for gold should prove rather limited. But as I noted in my previous Gold Weekly reports (see Gold Weekly: How The Wake-Up Call Feels, published on August 15), geopolitical tensions have escalated fairly quickly to an unprecedented level in the Korean Peninsula since the start of August, which could produce sooner rather than later a prolonged sell-off in risk assets as a North Korean nuclear agreement is far from being reached. Under such a scenario, I would expect a significant rise in speculative and investment demand for gold, which should boost prices.
My trading positioning
As a reminder, I have a long GLD position, a position that I opened on June 5. Below are the parameters of my trade.
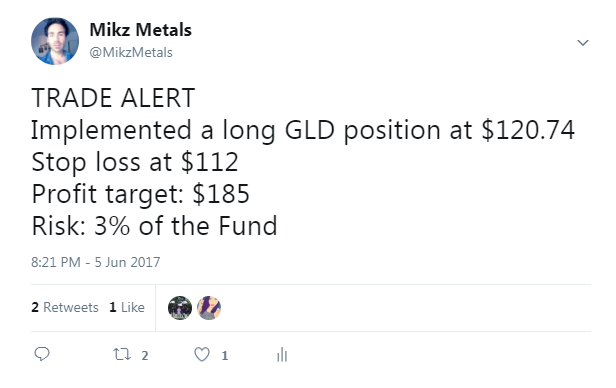
Let’s conclude this note by a simple technical analysis on GLD to see where we are heading in September. While I often use weekly charts in my Gold Weekly, I thought that a monthly chart of GLD would be interesting to look at the broader picture.

Source: Trading View.
As you can see above, GLD enjoyed a solid performance in August, up 4%. Importantly, GLD closed firmly above its downtrend line from the all-time high, confirming my initial conjecture that GLD would witness a powerful bullish breakout.
Finally, it seems that the 2016 low marked the end of the bear market that started in September 2011. The fact that GLD has remained attracted above its 20-month moving average corroborates this constructive thesis.
While I am going to let the parameters of my current long position unchanged, I am going to implement another long position with a higher risk, that is, with a tighter stop loss level.
This additional position is to play the current upward momentum of the market.

As you can see in my tweet, I opened a long GLD position at $125.30 with a stop loss level just below the downtrend line from the all-time high and the 20-month moving average, at $119. My theoretical target profit would be $190 (slightly above the all-time high). The reward to risk ratio – at 10.3 - would be heavily skewed in my favor. This position will represent 1% of the Fund.
As always, for the sake of transparency, I will publish my YTD track record including my open and closed trades at the end of my reports. I invite you to follow me on my Twitter account because I always tweet my trades in real-time.

Good trading to my dear friends from the Seeking Alpha community.
![]()