The Rose Portfolio currently holds 88 Stocks within 10 sectors.
My chart to follow will show them all by sector and % portfolio value and by income for 2017 and projected for 2018.

My last article here discussed 4 types of dividend yield within the portfolio, with the mystery holdings comprising 6% of the HHY or >4% yielding stocks.
The paid service, The Wheel is doing a free trial offer - so no mystery is needed any longer and I am now revealing everything I own within the portfolio.

Below is a chart of my portfolio by sectors showing % value on November 20th 2017, along with the current % income for 2017 and projected for 2018.
As many of the mystery holdings are new, I must look at how they will perform for income for the next total year. Looking at them for income for just a few months will not give a complete picture.
I have placed all new mystery holdings in Bold type.
Each column head has the total of that column for all the holdings in the sector.
-First column listing is by % Portfolio Value
-next is % income for 2017 and
-finally 2018 Income estimates.
Next, and to follow this first chart, I have compressed these results by showing the 62 stocks by decreasing income for the 92.9% of the portfolio income.
| Name | %PV | %Income | 2018 | |
| CONSUMER | Staples-16 | 22.0% | 16.6% | 17.6% |
| Anh-Busch | (BUD) | 0.47% | 0.37% | 0.36% |
| Colgate-P | (CL) | 0.44% | 0.25% | 0.24% |
| CVS Health | (CVS) | 0.58% | 0.56% | 0.43% |
| Diageo | (DEO) | 1.95% | 1.15% | 1.21% |
| General Mills | (GIS) | 2.32% | 1.79% | 1.96% |
| Hershey | (HSY) | 0.90% | 0.20% | 0.51% |
| Kraft-Hnz | (KHC) | 0.38% | 0.30% | 0.28% |
| K-Clark | (KMB) | 2.58% | 1.52% | 2.09% |
| Coca-Cola | (KO) | 2.31% | 1.89% | 1.95% |
| Mondelez | (MDLZ) | 0.66% | 0.30% | 0.33% |
| Altria* | (MO) | 1.99% | 1.86% | 1.92% |
| Pepsi Co | (PEP) | 0.84% | 0.59% | 0.57% |
| P & Gamble | (PG) | 1.26% | 0.97% | 0.91% |
| Philip Mo | (PM) | 2.77% | 2.78% | 2.70% |
| JM Smucker | (SJM) | 1.16% | 0.29% | 0.74% |
| Target | (TGT) | 1.41% | 1.78% | 1.43% |
| CONSUMER | Disc -5 | 6.0% | 2.8% | 3.2% |
| Genuine P | (GPC) | 1.41% | 0.60% | 1.03% |
| Home Depot | (HD) | 1.56% | 0.71% | 0.84% |
| McDonald's | (MCD) | 1.36% | 0.78% | 0.76% |
| Nike | (NKE) | 1.45% | 0.44% | 0.45% |
| Starbucks | (SBUX) | 0.23% | 0.23% | 0.11% |
| ENERGY | Energy-7 | 8.4% | 10.5% | 12.0% |
| Alerian Mlp | (AMLP) | 0.17% | 0.23% | 0.31% |
| Amza | (AMZA) | 0.65% | 1.91% | 3.88% |
| Chevron | (CVX) | 0.70% | 0.83% | 0.62% |
| Occidental | (OXY) | 1.93% | 2.11% | 2.01% |
| Royal Dutch | (RDS-B) | 1.82% | 2.64% | 2.45% |
| Valero | (VLO) | 1.00% | 0.79% | 0.84% |
| Exxon | (XOM) | 2.13% | 2.00% | 1.90% |
| FINANCIAL | Financl -12 | 7.4% | 5.7% | 9.9% |
| Arbor Realty | (ABR) | 0.07% | 0.04% | 0.14% |
| Great Ajax | (AJX) | 0.87% | 1.03% | 1.79% |
| Apollo Global | (APO) | 0.34% | 0.11% | 0.44% |
| Blackstone | (BXMT) | 0.26% | 0.13% | 0.46% |
| Cherry Hill | (CHMI) | 0.74% | 0.50% | 1.83% |
| Chimera P 8% | (CIMpB) | 0.11% | 0.10% | 0.19% |
| Mastercard | (MA) | 1.83% | 0.27% | 0.28% |
| Metlife | (MET) | 0.16% | 0.12% | 0.11% |
| New Res | (NRZ) | 0.86% | 2.38% | 2.24% |
| Brookfield | (RA) | 0.67% | 0.67% | 1.56% |
| Sutherland | (SLD) | 0.32% | 0.20% | 0.69% |
| Visa | (V) | 1.12% | 0.18% | 0.19% |
| BDC | BDC -4 | 2.8% | 4.4% | 6.3% |
| Gladstone | (GAIN) | 0.44% | 0.87% | 0.83% |
| Monroe | (MRCC) | 0.83% | 1.22% | 1.83% |
| Newtek | (NEWT) | 0.86% | 1.76% | 1.85% |
| Triple Point | (TPVG) | 0.71% | 0.55% | 1.75% |
| HEALTH-C | H-Care- 10 | 11.6% | 7.5% | 7.5% |
| AbbVie | (ABBV) | 2.39% | 1.54% | 1.63% |
| Amgen | (AMGN) | 1.03% | 0.71% | 0.71% |
| B Dickinson | (BDX) | 0.90% | 0.29% | 0.30% |
| Bristol-Myer | (BMY) | 0.50% | 0.24% | 0.30% |
| Cardinal H | (CAH) | 1.01% | 0.72% | 0.78% |
| Celgene | (CELG) | 0.06% | 0.00% | 0.00% |
| Johnson & J | (JNJ) | 3.65% | 2.24% | 2.16% |
| Medtronic | (MDT) | 0.48% | 0.26% | 0.26% |
| Pfizer | (PFE) | 1.44% | 1.31% | 1.27% |
| Teva | (TEVA) | 0.16% | 0.21% | 0.10% |
| INDUSTRL | Industr'l -7 | 7.0% | 4.1% | 4.2% |
| Boeing | (BA) | 2.96% | 1.60% | 1.60% |
| Cummins | (CMI) | 0.98% | 0.65% | 0.60% |
| Covanta | (CVA) | 0.30% | 0.31% | 0.47% |
| WWGrainger | (GWW) | 0.41% | 0.26% | 0.25% |
| Lockheed M | (LMT) | 0.90% | 0.53% | 0.54% |
| 3M | (MMM) | 0.94% | 0.48% | 0.47% |
| Union Pacific | (UNP) | 0.47% | 0.25% | 0.24% |
| TECH | Tech -4 | 3.0% | 1.7% | 2.0% |
| A Data Proc | (ADP) | 0.90% | 0.55% | 0.44% |
| Cisco | (CSCO) | 1.26% | 0.96% | 0.99% |
| Int Bus M | (IBM) | 0.31% | 0.08% | 0.29% |
| Intel | (INTC) | 0.55% | 0.14% | 0.31% |
| TEL-CO | Telco -2 | 6.3% | 8.2% | 7.8% |
| AT&T | (T) | 2.89% | 4.13% | 3.84% |
| Verizon | (VZ) | 3.39% | 4.07% | 3.96% |
| UTILITIES | Ute -7 | 14.0% | 12.5% | 11.8% |
| Dominion | (D) | 3.14% | 2.82% | 2.79% |
| DNP Fund | (DNP) | 1.06% | 1.83% | 1.67% |
| Alliant | (LNT) | 0.72% | 0.52% | 0.50% |
| MGE Energy | (MGEE) | 2.20% | 1.12% | 0.97% |
| Southern Co | (SO) | 2.71% | 3.14% | 2.89% |
| WEC Energy | (WEC) | 1.66% | 1.28% | 1.24% |
| Xcel Energy | (XEL) | 2.50% | 1.77% | 1.72% |
| R Estate | H-Care -3 | 3.6% | 6.2% | 6.8% |
| Omega | (OHI) | 1.97% | 4.53% | 4.42% |
| Sabra | (SBRA) | 0.46% | 0.32% | 1.01% |
| Ventas | (VTR) | 1.18% | 1.31% | 1.37% |
| RE: MISC | REIT -11 | 7.9% | 10.1% | 10.9% |
| Apple Hotel | (APLE) | 0.47% | 0.63% | 0.67% |
| CorEnergy | (CORR) | 0.29% | 0.15% | 0.57% |
| Digital R | (DLR) | 0.84% | 0.84% | 0.65% |
| Kimco | (KIM) | 0.62% | 0.28% | 0.84% |
| Tanger | (SKT) | 0.69% | 0.56% | 0.93% |
| Simon P Gr | (SPG) | 0.81% | 0.56% | 0.86% |
| Stag Ind | (STAG) | 0.81% | 1.04% | 0.93% |
| Store | (STOR) | 0.21% | 0.37% | 0.24% |
| Uniti | (UNIT) | 0.06% | 0.00% | 0.22% |
| W.P. Carey | (WPC) | 2.62% | 4.07% | 3.43% |
| Wash Prime | (WPG) | 0.50% | 1.59% | 1.59% |
| SOLD Income | 9.77% |
 INCOME for 2018
The BOLD type shows the mystery stocks and they are also boldly framed.
An * on a ticker is an A-team stock, another series of holdings I learned about in 2016 from The Fortune Teller.
The chart below reveals the stocks and how the majority of the income is derived.
92.9% of the income come from the following 62 stocks by yield:
>=2% =14 stocks holding 40.8% of income.
>=1% =23 stocks and 34.8% of the income.
>=0.5% = 25 stocks and 17.3% of income.
| 14 | 2018 E Inc | 23 | 2018 E Inc | 25 | 2018 E Inc | Total 62 |
| Ticker | >=2% | Ticker | >=1% | Ticker | >=0.5% | |
| OHI | 4.4 | KO | 1.9 | PG | 0.9 | |
| VZ | 4 | MO | 1.9 | VLO | 0.9 | |
| AMZA | 3.9 | XOM | 1.9 | SKT | 0.9 | |
| T | 3.8 | AJX | 1.8 | SPG | 0.9 | |
| WPC | 3.4 | CHMI | 1.8 | STAG | 0.9 | |
| SO | 2.9 | MRCC | 1.8 | HD | 0.8 | |
| D | 2.8 | NEWT* | 1.8 | MCD | 0.8 | |
| PM | 2.7 | TPVG | 1.7 | GAIN* | 0.8 | |
| RDS/B | 2.5 | DNP | 1.7 | C AH | 0.8 | |
| NRZ* | 2.2 | XEL | 1.7 | KIM | 0.8 | |
| JNJ | 2.2 | ABBV | 1.6 | SJM | 0.7 | |
| GIS | 2 | BA | 1.6 | SLD | 0.7 | |
| KMB | 2 | WPG | 1.6 | AMGN | 0.7 | |
| OXY | 2 | RA | 1.5 | APLE | 0.7 | |
| TGT | 1.4 | PEP | 0.6 | |||
| VTR | 1.4 | CVX | 0.6 | |||
| PFE | 1.3 | CMI | 0.6 | |||
| DEO | 1.2 | CORR | 0.6 | |||
| WEC | 1.2 | DLR | 0.6 | |||
| GPC | 1 | HSY | 0.5 | |||
| CSCO | 1 | BXMT | 0.5 | |||
| MGEE | 1 | CVA | 0.5 | |||
| SBRA | 1 | LMT | 0.5 | |||
| MMM | 0.5 | |||||
| LNT | 0.5 | |||||
| 40.8 | 34.8 | 17.3 | 92.9 |
The take away here is rather revealing for me and I will speak to that in just a bit, but first a quick note about RICs or
Regulated Investment Companies
RICs pay distributions and not dividends, as they are required to pay out minimum 90% of investment income allowing for higher income for us investors. They have other hurdles to complete to be designated as such by the IRS, but for now this is all you need to know as to why they can pay such wonderful income. Note in some cases they may even pay out more than the required 90% which is entirely legal.
Equity REITs or Real Estate Investment Trusts have their own sector which was formed at the end of 2016 called simply Real Estate.
Mortgage REITs remain in The Financial sector along with BDCs or Business Development companies. I separate them by those designations to help me keep track of them by sector and my income generated.
MLPs are also RICs which I own in ETF funds AMZA and AMLP because these particular holdings do not generate K-1 tax forms. Most all MLPs alone otherwise would.
I did expect to see many of the RICs show up in top spots and they did not disappoint.
Results:
#1 is OHI at 4.4% of projected 2018 income.
Omega is a healthcare equity REIT.
I do definitely see a bit of danger with OHI and I am depending on management to be telling us the truth regarding the tenant troubles. 2018 could get interesting with this one, but right now I am on Hold with it, and NOT buying more.
ETF MLP of AMZA popped up as #3.
I should not have been surprised with its 22% dividend yield for my shares. However, it might have a dividend cut perhaps next year if the MLPs do not get popular again. Another interesting one to watch closely, thus I am NOT buying more at this time.
NRZ* a mortgage REIT is doing terrific in the 10th spot and I have owned this one since 2016. It truly has been a fantastic holding still with 11+ % yield and wonderful capital gains as well. I thank The Fortune Teller and the A-Team articles for introducing it to me and SA.
New Holdings are mostly Financials:
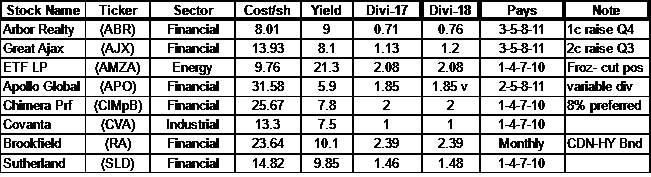
Below is a little chart showing my new 8 investments, showing AMZA and Covanta as well.
The 6 new financial investments and mortgage REITs ideas purchased were chosen from The Wheel - the paid subscription service of The Fortune Teller:
I picked asset managers APO and SLD to replace T Rowe Price (TROW) that was sold in September.
Note RA is a Canadian HY- high yield - Bond Fund manager of importantly in this rising rate time period of short duration bonds.
I now own one preferred note of Chimera with 8% yield.
Covanta is an environmental industrial dealing in generating new energy from old waste.
Lesson:
A little purchase can go a long way with RICs and being diversified throughout the group is important.
The RICs also behave in their own manner as individual sectors and when one group is up, the others may be down. They rarely all move together.
That holds true presently in the equity REITs with the data centers performing really well and the retail sector being hit hard and down.
I see the BDCs also holding nice spots in the income. I enjoy having a small basket of those: GAIN*, MRCC, NEWT, and TPVG.
It is impossible to group any of them together and must always be considered on individual merits like any other investment instrument.
Sold
VF Corp was sold for being over valued and yield declining now to 2.6%. None the less, I did it. I did buy it low and sell it somewhat high- so that was good and all done in a Roth. It had ~ 3.4% dividend yield at my buy price so I am looking to replace that income for 2018.
Thus far I have added more shares of GPC with ~ 3.2% yield and hopefully will continue to add more just a little bit lower. No hurry.
I also have just today, Nov 21st, added more CAH with its 3.4% yield- truly under priced quality healthcare stock.
Income increase for 2018
With the addition of the new RICs it looks like dividend income will increase by ~ 8.5%.
Some of it will be from dividend raises by the core holdings and some from juicing it with the RICs.
Perhaps this gives you some ideas on income generation enhancement.
For now I am enjoying owning RICs along with my Core portfolio.
I wish you all a Happy Thanksgiving with love and God's Blessings,

And yes, Happy Investing too.