The OPEC data below was taken from the December OPEC Monthly Oil Market Report. All data is through November 2017 unless otherwise noted.
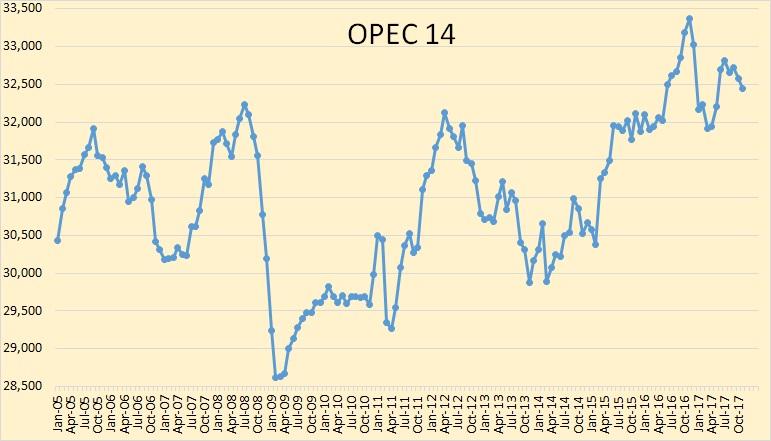
OPEC crude oil production declined by 133,500 barrels per day in November.
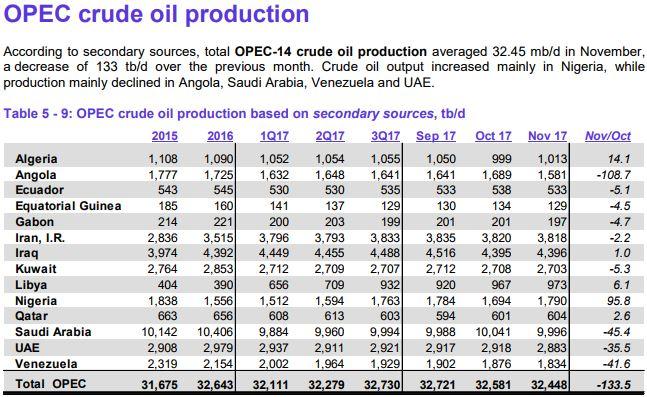

Algeria was up slightly in November after that huge decline in October.
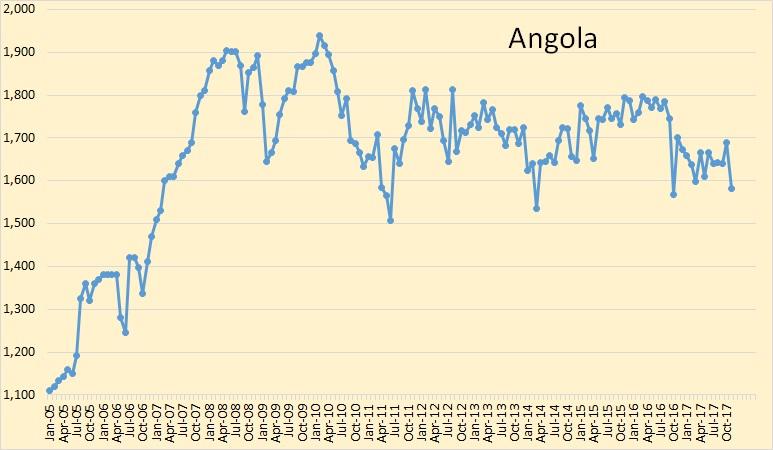
Angola was the biggest loser in November, down 108,700 barrels per day.
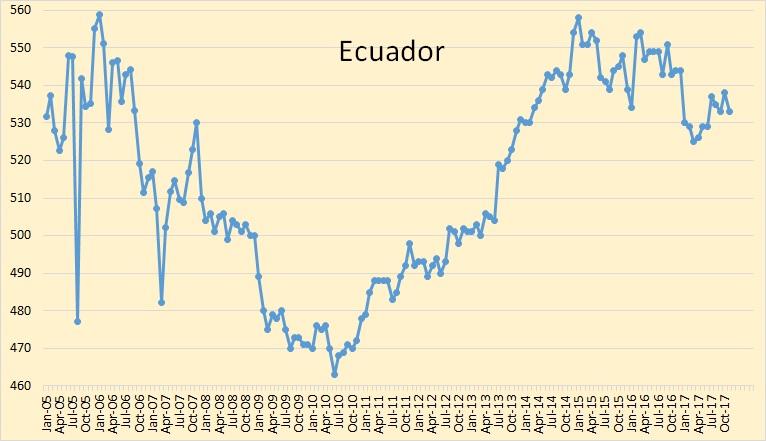
Ecuador, though holding its own for the last year, appears to be in slow decline.
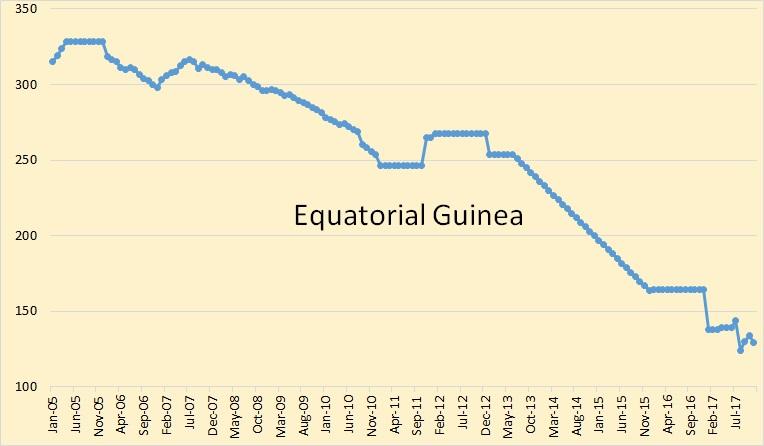
I have managed to cobble together an estimate of Equatorial Guinea's historical C+C production. I had the EIA's production numbers through June 2013. I subtracted 10% for "other liquids," then merged that with the OPEC MOMR data that started in 2016. However, Equatorial Guinea's production is not enough to make much difference.

Gabon is also in slow decline. And their production is not enough to make much difference in total OPEC production.
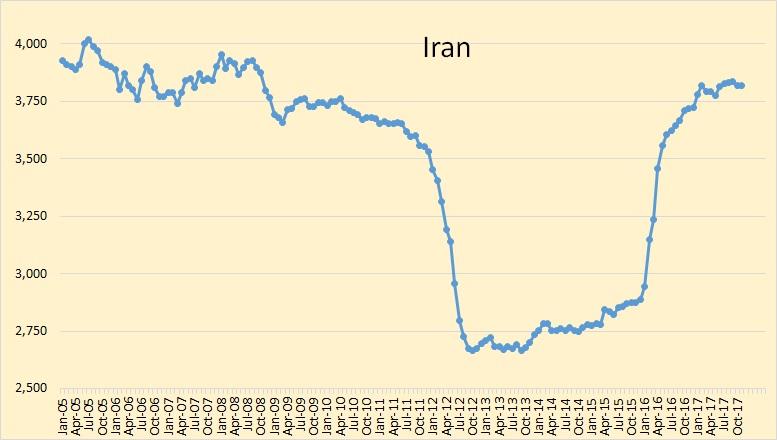
Iran ignores any OPEC request to cut production and continues to produce flat out.
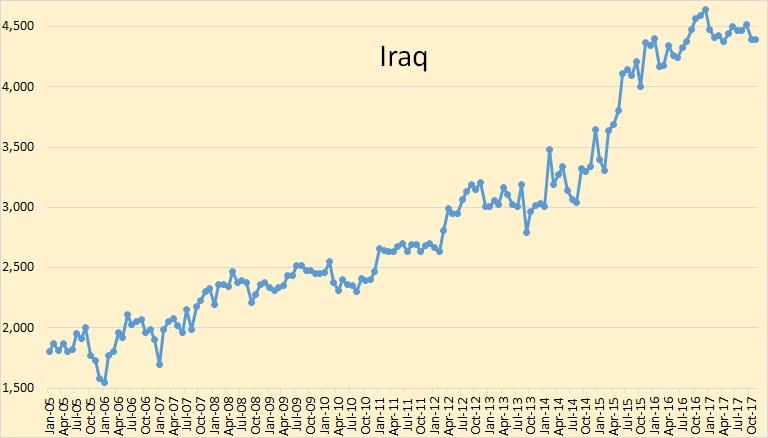
Iraq peaked last December and down only slightly since then.
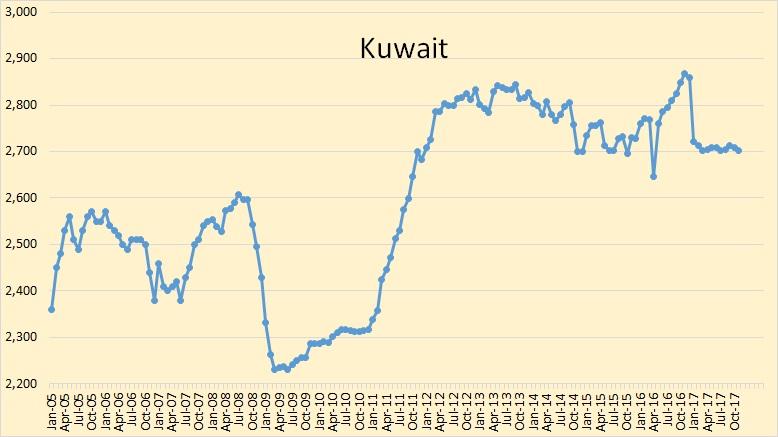
Kuwait peaked last November then dropped sharply in January and has held steady since then.
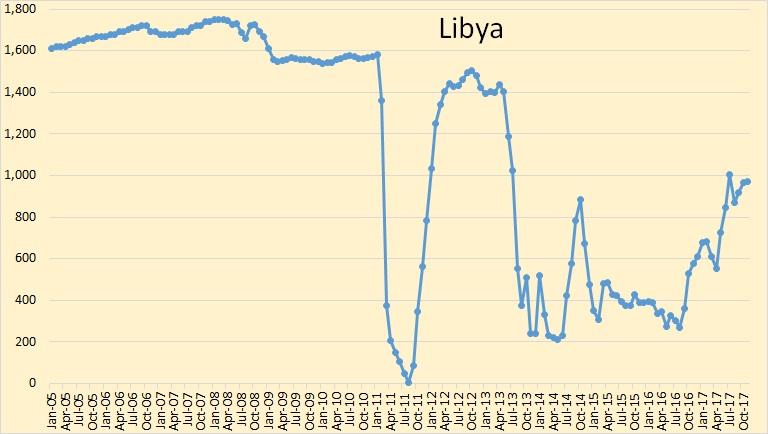
Libya's political problems have ebbed but their oil production doesn't seem to be responding very much.
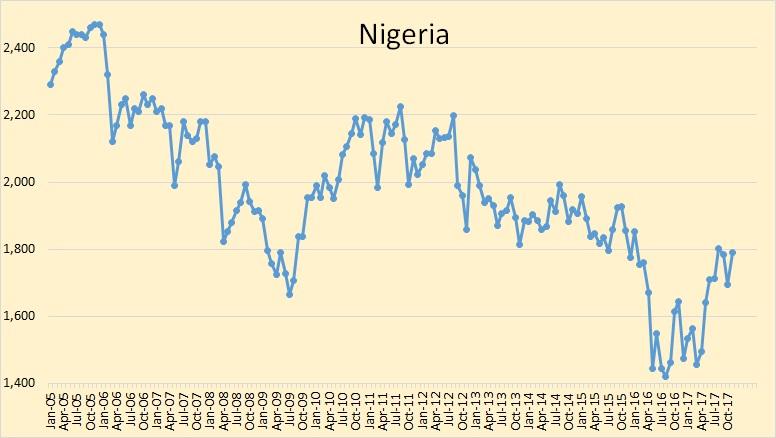
Libya was the largest gainer in November, up 95,800 barrels per day. It looks like Nigeria peaked in 2005 and has been declining since.

Qatar peaked in 2008. Their big exports are natural gas and natural gas products.
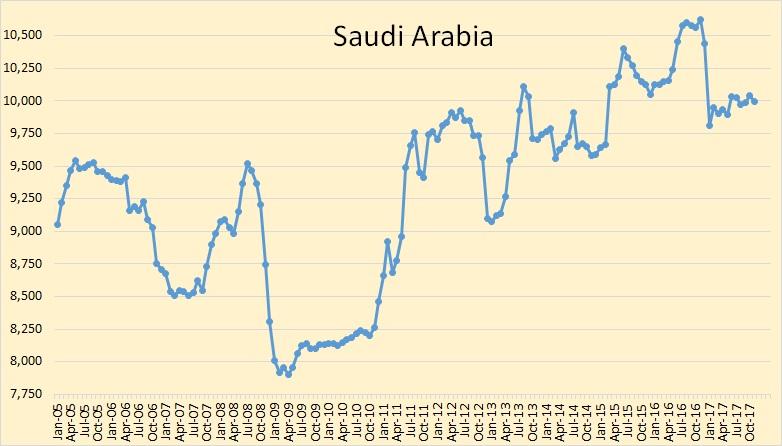
Saudi Arabia is holding steady, down about 600,000 bpd since peaking last year.
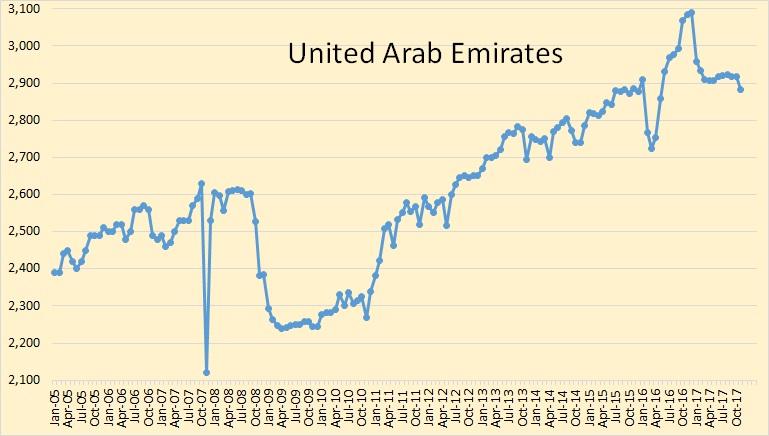
The UAE was down 35,500 bpd in November.
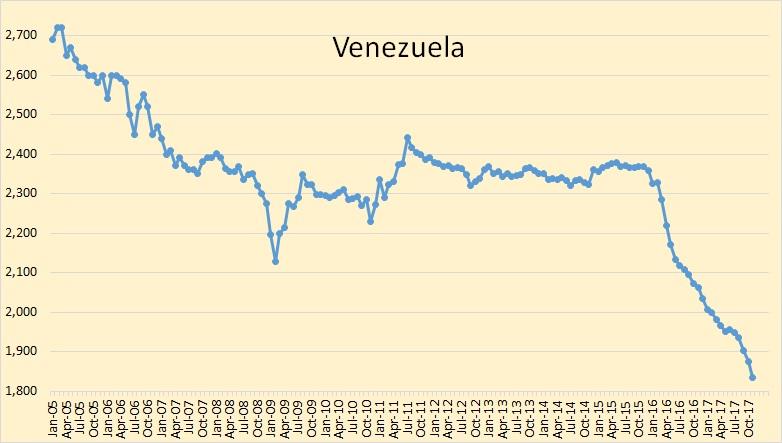
Venezuela's decline continues. They were down 41,600 bpd in November. Venezuela is on the verge of becoming a failed state. What happens to their oil production in the future is anyone's guess. But it doesn't look good.
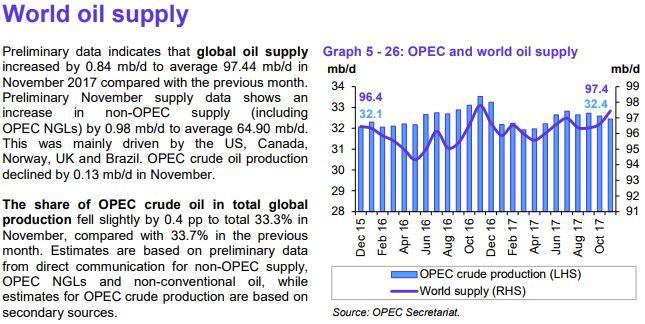
The OPEC MOMR says world oil production was up 840,000 barrels per day in November while OPEC crude production was down 133,500 bpd. That would mean Non-OPEC total liquids + OPEC NGLs would be up 973,500 bpd. I don't really think so. Russian C+C was up only 7,700 bpd so that means Non-OPEC and OPEC NGLs were up 965,800 bpd. I think that figure will have to be revised downward.
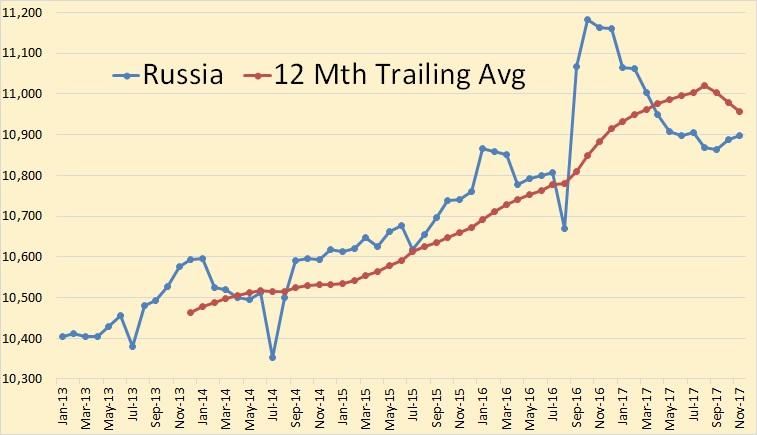
Russia C+C oil production according to the Russian Oil Minister. I am using 7.3 barrels per ton here. The Oil Minister's production numbers average about 400,000 barrels per day above the EIA's Russia production numbers. I have no idea why we have this discrepancy. Both are supposed to be crude + condensate.
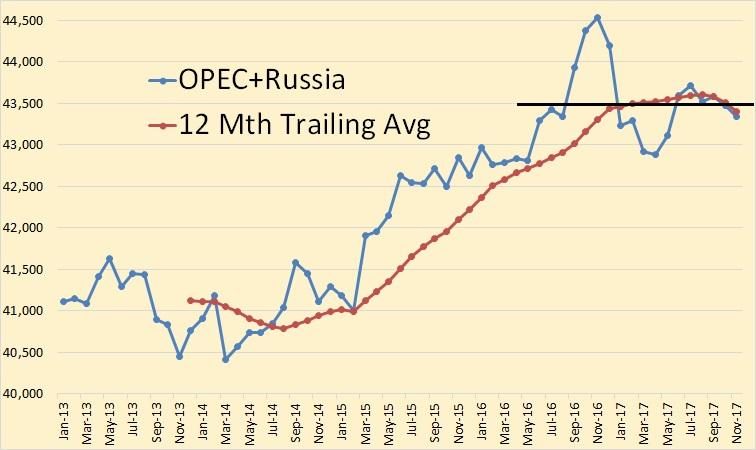
OPEC + Russia is 57% of world oil production. The last four months of 2016 are all above the black line in the chart above. This was all "positioning" for future cuts. This could have been done by draining storage tanks and delaying well maintenance. The sudden decline, January through May, was refilling storage tanks and catching up on well maintenance. The six months since then, June through November, is everyone producing every barrel they possibly can, or near that anyway.
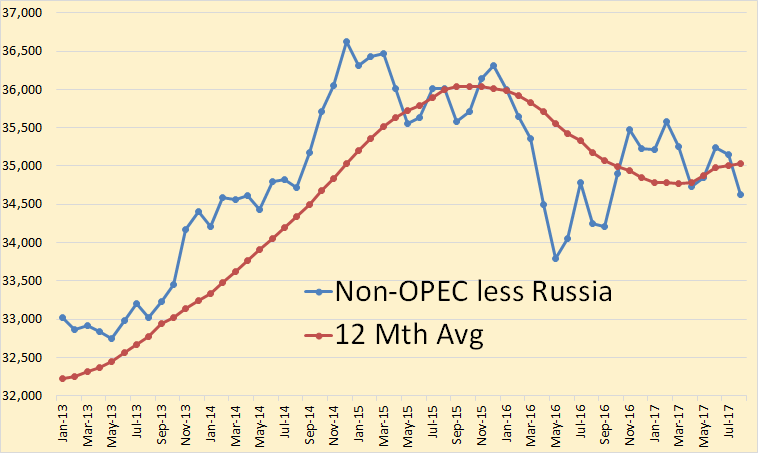
Here is the other 43% of world oil production, Non-OPEC less Russia. This data is only through August 2017, the latest EIA data. Non-OPEC less Russia peaked in December of 2014 and is down 2 million barrels per day since then. The 12 months trailing average peaked 10 months later and is down 1 million barrels per day since, or in August 2017.
Note: For the first chart, OPEC + Russia, I used the Russian Oil Minister's data. For the Non-OPEC less Russia chart above, I used all EIA data.