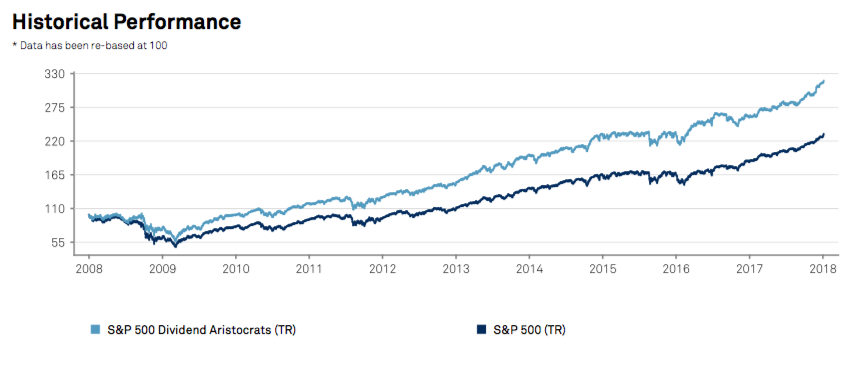
The 50 stocks that make up the S&P 500 Dividend Aristocrats index have increased their dividend for 25 consecutive years or more. You can buy all of the stocks in this index in one shot via an exchange traded fund, like the ProShares S&P 500 Dividend Aristocrats ETF (NOBL), and it's not a bad idea. This elite group of dividend stocks has trounced the broader stock market.
 Source: S&P Global
But, is it possible to beat the Dividend Aristocrats index by cherry-picking individual stocks from within it? I think so. Firstly, I analyzed each of the Dividend Aristocrats to see:
- Which stocks are selling most cheaply relative to their cash flow;
- Which companies have earned the highest returns on their invested capital; and
- Which stocks offer the highest dividend yields (with bonus points awarded to the dividends that appear safest and most sustainable).
Secondly, I ranked each company using an equally-weighted composite score of these criteria, and finally, I grouped them. I'm not a good stock picker, but I've been successful picking groups of stocks that outperform their benchmarks.
Know this: The Dividend Aristocrats are the cream of the crop. I'm arguing that some aristocrats are relatively better than others, but they are all solid companies. Think of the groups below as "good," "better" and "best," even though the headline of this article says "best and worst." I own stocks that appear in the lowest-ranked bucket, and I don't plan to sell them, because they are great companies that I believe in. (In fact, Becton Dickinson (BDX) is in my buy-and-hold forever dividend portfolio.)
Gold-Medal Dividend Aristocrats
Avg. Market Capitalization: $72.44B
Avg. Liability-Adjusted Cash Flow Yield: 4.27%
Avg. Return on Invested Capital: 23.09%
Avg. Dividend Yield: 2.62%
| Company | Market Cap (Billions) | Cash Flow Yield | Return on Capital | Dividend Yield | Dividend Coverage Ratio |
| GENUINE PARTS CO (GPC) | 14.29 | 3.98% | 46.59% | 2.77% | 1.44 |
| TARGET CORP (TGT) | 36.17 | 5.47% | 16.26% | 3.73% | 1.47 |
| EMERSON ELECTRIC CO (EMR) | 46.49 | 4.00% | 27.22% | 2.68% | 1.49 |
| ARCHER DANIELS MIDLAND CO (ADM) | 22.47 | 5.08% | 13.44% | 3.19% | 1.59 |
| W W GRAINGER INC (GWW) | 13.58 | 3.80% | 24.92% | 2.15% | 1.77 |
| KIMBERLY-CLARK CORP (KMB) | 41.57 | 3.58% | 32.34% | 3.28% | 1.09 |
| LEGGETT & PLATT INC (LEG) | 6.31 | 4.02% | 22.65% | 3.01% | 1.33 |
| WALGREENS BOOTS ALLIANCE INC (WBA) | 72.22 | 4.44% | 13.03% | 2.19% | 2.01 |
| FRANKLIN RESOURCES INC (BEN) | 24.13 | 8.21% | 9.50% | 2.11% | 3.89 |
| COLGATE-PALMOLIVE CO (CL) | 66.23 | 3.23% | 46.53% | 2.12% | 1.52 |
| VF CORP (VFC) | 29.91 | 3.24% | 34.25% | 2.43% | 1.33 |
| COCA-COLA CO/THE (KO) | 196.29 | 3.28% | 29.33% | 3.21% | 1.02 |
| PROCTER & GAMBLE CO (PG) | 231.47 | 3.70% | 15.17% | 3.02% | 1.22 |
| WAL-MART STORES INC (WMT) | 296.62 | 3.74% | 13.89% | 2.04% | 1.83 |
| CARDINAL HEALTH INC (CAH) | 19.93 | 3.41% | 23.66% | 2.93% | 1.16 |
| LOWE'S COS INC (LOW) | 78.61 | 3.43% | 17.42% | 1.73% | 1.98 |
| AFLAC INC (AFL) | 35.28 | 5.92% | 6.28% | 2.01% | 2.94 |
Silver-Medal Dividend Aristocrats
Avg. Market Capitalization: $95.79B
Avg. Liability-Adjusted Cash Flow Yield: 3.08%
Avg. Return on Invested Capital: 16.20%
Avg. Dividend Yield: 2.35%
| Company | Market Cap (Billions) | Cash Flow Yield | Return on Capital | Dividend Yield | Dividend Coverage Ratio |
| PEPSICO INC (PEP) | 168.77 | 3.26% | 24.11% | 2.71% | 1.20 |
| JOHNSON & JOHNSON (JNJ) | 380.71 | 3.39% | 16.54% | 2.37% | 1.43 |
| DOVER CORP (DOV) | 15.95 | 3.65% | 12.39% | 1.84% | 1.98 |
| CLOROX CO (CLX) | 18.79 | 2.94% | 30.29% | 2.31% | 1.27 |
| HORMEL FOODS CORP (HRL) | 19.25 | 3.42% | 14.83% | 2.06% | 1.66 |
| 3M CO (MMM) | 143.29 | 2.92% | 25.09% | 1.95% | 1.50 |
| GENERAL DYNAMICS CORP (GD) | 61.12 | 2.88% | 25.04% | 1.64% | 1.76 |
| PENTAIR PLC (PNR) | 13.19 | 3.53% | 9.17% | 1.93% | 1.83 |
| PPG INDUSTRIES INC (PPG) | 30.26 | 2.98% | 16.49% | 1.51% | 1.97 |
| ILLINOIS TOOL WORKS INC (ITW) | 56.88 | 2.86% | 24.12% | 1.88% | 1.52 |
| ABBVIE INC (ABBV) | 161.18 | 2.86% | 15.84% | 2.81% | 1.02 |
| CINCINNATI FINANCIAL CORP (CINF) | 12.14 | 3.54% | 4.19% | 2.70% | 1.31 |
| SYSCO CORP (SYY) | 32.02 | 2.54% | 17.49% | 2.34% | 1.08 |
| T. ROWE PRICE GROUP INC (TROW) | 25.98 | 2.94% | 10.35% | 2.13% | 1.38 |
| MEDTRONIC INC (MDT) | 115.78 | 3.15% | 7.44% | 2.15% | 1.46 |
| AT&T INC (T) | 234.14 | 3.06% | 4.83% | 5.24% | 0.58 |
| MCDONALD'S CORP (MCD) | 140.98 | 2.36% | 17.09% | 2.32% | 1.02 |
Bronze-Medal Dividend Aristocrats
Avg. Market Capitalization: $69.78B
Avg. Liability-Adjusted Cash Flow Yield: 1.64%
Avg. Return on Invested Capital: 6.61%
Avg. Dividend Yield: 1.99%
| Company | Market Cap (Billions) | Cash Flow Yield | Return on Capital | Dividend Yield | Dividend Coverage Ratio |
| S&P GLOBAL INC (SPGI) | 44.80 | 1.88% | 10.86% | 0.93% | 2.02 |
| NUCOR CORP (NUE) | 21.57 | 2.67% | 8.31% | 2.24% | 1.19 |
| CINTAS CORP (CTAS) | 17.18 | 1.93% | 9.86% | 1.00% | 1.93 |
| BECTON DICKINSON AND CO (BDX) | 50.95 | 2.39% | 8.35% | 1.35% | 1.77 |
| AIR PRODUCTS AND CHEMICALS INC (APD) | 36.86 | 2.40% | 9.50% | 2.26% | 1.06 |
| BROWN-FORMAN CORP (BF.B) | 26.01 | 1.67% | 18.56% | 1.16% | 1.44 |
| SHERWIN-WILLIAMS CO (SHW) | 39.43 | 1.81% | 7.70% | 0.81% | 2.23 |
| EXXON MOBIL CORP (XOM) | 367.57 | 2.21% | 4.40% | 3.55% | 0.62 |
| ABBOTT LABORATORIES (ABT) | 102.68 | 2.56% | 7.26% | 1.90% | 1.35 |
| ECOLAB INC (ECL) | 39.63 | 1.90% | 7.67% | 1.20% | 1.58 |
| STANLEY BLACK & DECKER INC (SWK) | 26.16 | 2.22% | 6.41% | 1.48% | 1.50 |
| CONSOLIDATED EDISON INC (ED) | 25.35 | 0.19% | 0.27% | 3.38% | 0.06 |
| CHEVRON CORP (CVX) | 242.93 | -0.48% | -0.82% | 3.38% | -0.14 |
| FEDERAL REIT (FRT) | 9.31 | -0.99% | -2.12% | 3.12% | -0.32 |
| MCCORMICK & CO INC (MKC) | 13.51 | 1.97% | 5.34% | 2.02% | 0.98 |
| AUTOMATIC DATA PROCESSING INC (ADP) | 52.46 | 1.83% | 4.20% | 2.13% | 0.86 |
Formulas, Methodology and Calculations
Here is a brief explanation of the metrics I used to rank the stocks above and how I weighted their composite scores.
Liability-Adjusted Cash Flow Yield
This is a simple formula that gives you the "ownership yield" of an established company. In other words, if you were to buy an entire company and assume all of its debts, this formula tells you what kind of return you should expect. (This yield is also useful for judging the relative attractiveness of a stock versus a bond.)
6-Year Avg. Free Cash Flow / ((Outstanding Shares x Per Share Price) + (Liabilities - Cash))
I like to use 5 to 10 years worth of cash flow data to establish the average earning power of a company. This helps to smooth out the data for cyclical companies, but these long-term averages can undervalue growing companies and overvalue a company in decline. A good fundamental analyst can do a better job valuing a company than this formula can.
Return on Invested Capital
This formula looks at how much cash a company is generating relative to the money it invested in its operations. Companies that require physical stuff to operate (like railroads) will have lower returns on capital. Companies that own intellectual property (like software or franchise rights) will have higher returns on capital. Higher returns are generally better.
6-Year Avg. Free Cash Flow / ((Total Assets - Current Assets - Current Liabilities) + Inventories))
Most people consider invested capital to be the total assets of the company minus the short term assets and liabilities that are necessary for day-to-day business. I calculate return on invested capital a little differently because I treat inventories as invested capital (inventory can spoil, become obsolete, or lose value if the public's taste changes).
An important note: There are seven companies in this analysis where I was unable to calculate return on invested capital. That's because real-estate and financial services companies organize their balance sheets differently than other companies. For these exceptions, I used a "return on assets" yield.
Dividend Coverage Ratio
A dividend is at risk if the dividend yield of a stock is greater than the liability-adjusted cash flow yield. It's not a guarantee that a dividend cut is coming, but it's a red flag. Consider the 2010 Dividend Aristocrats. 50% of the stocks that failed the "dividend acid test" are no longer aristocrats. Meanwhile, 93% of the stocks that passed the test in 2010 still remain on the current list.
Only seven companies in the 2018 list failed my dividend acid test. Here they are, ordered from most to least at risk of a dividend freeze or cut:
- Federal REIT
- Chevron
- Consolidated Edison
- AT&T
- Exxon Mobil
- Automatic Data Processing
- McCormick & Co.
Final Scoring
These are the four criteria that I used to build my composite score:
- Liability-adjusted cash flow yield;
- Return on invested capital;
- Dividend yield; and
- Dividend coverage ratio.
Each company had the chance to earn one to 50 points per criterion. For example, the company with the highest cash flow yield earned 50 points for valuation; the company with the lowest cash flow yield earned only 1 point. My final ranking is based on the combined point tally from each of these four categories. (Note: The companies that have a dividend coverage ratio of less than 1 failed my dividend safety test and earned 0 points for that criterion.)
Final Thoughts
"Beware of geeks bearing formulas." Warren Buffett wrote that in 2009 and it's still good advice. I hope that you treat the data in this article as a starting point for your own research, rather than as a list of stocks to buy. Nevertheless, if you do go shopping from this list, remember that I'm not recommending any single stock above the others. It's the entire group of top-rated stocks that I think will outperform the index as a whole.
Happy New Year and happy investing!