The outlook is based on BOFA 1,870 debt issues, which together represent c. $1.25 trln in principal amount (most of the issues are represented in HYG).
US High Yield Index was down this week, by 11.5 bps. Most of the decline came from Communications this week, which fell by 48 bps and contributed more than 80% of the overall HY decline, as it can be seen from Figure 1. Energy sector gained 32 bps this week. Other sectors slightly declined on 10-15 bps.
Figure 1. Contribution of sectors to changes in BOFA High-Yield Index over the week
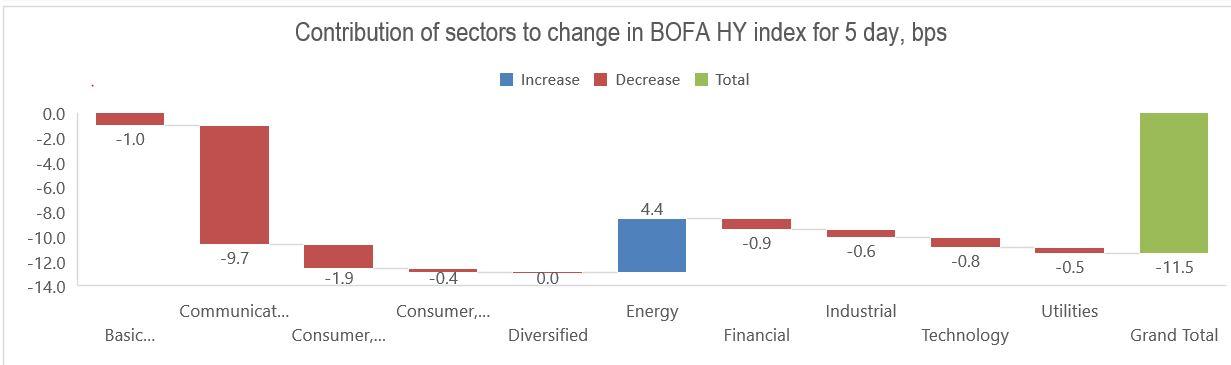 Source: Bloomberg Terminal, Lighthouse Research
Figure 2. Change in US Treasury Active Contracts Curve for the last week
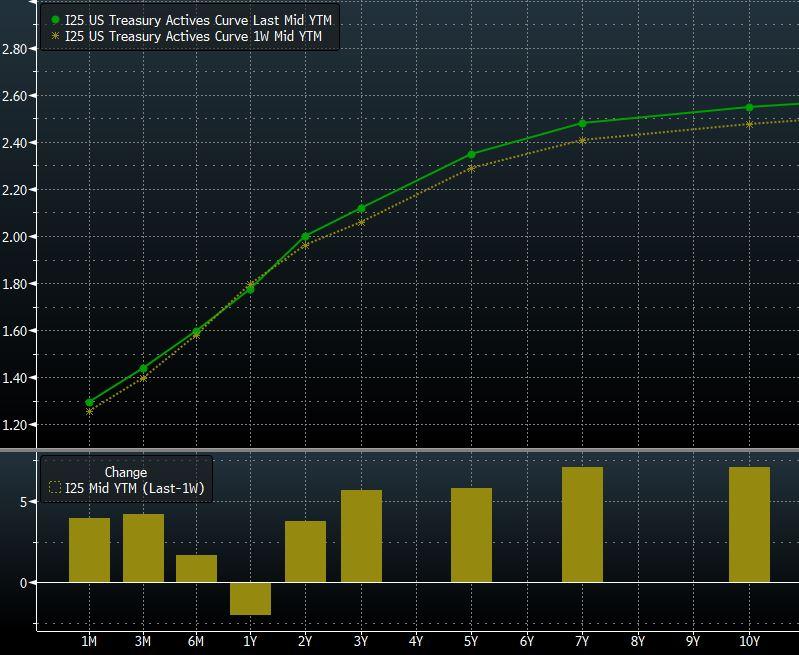 Source: Bloomberg Terminal
US Treasury
US Treasury yields increased this week. Two-year note yield increased by 3 bps and rose above 2 per cent for the first time since 2008. Five-year note yield increased by 6 bps this week. The negative effect of higher short-term UST yield on high yield bond prices is approximately 10.5 bps (3Y UST yield increased by 3 bps and average modified duration of high yield bonds is 3.5). Short-term and medium term UST yields increased primarily due to strong economic data in the US, especially US inflation. After the data, investors began increasing their expectations for Federal Reserve rate hikes this year. They now see a hike in March, a second hike in June and a 51 percent chance of a third hike in December, according to the CME's FedWatch tool.
Changes in sectors from High-Yield perspective
Figure 3. Statistics breakdown by sectors
| Sector | Issues | Weight | YTM | YTW | Mdur | 5D change |
| Basic Materials | 154 | 6.97 | 5.34 | 3.68 | 4.00 | -0.15% |
| Communications | 278 | 20.04 | 6.67 | 6.15 | 3.65 | -0.48% |
| Consumer, Cyclical | 328 | 14.56 | 5.41 | 4.73 | 3.40 | -0.13% |
| Consumer, Non-cyclical | 259 | 15.94 | 6.05 | 5.37 | 3.36 | -0.02% |
| Diversified | 6 | 0.27 | 3.42 | 1.77 | 3.22 | -0.10% |
| Energy | 313 | 13.95 | 6.10 | 5.44 | 3.74 | 0.32% |
| Financial | 190 | 10.42 | 4.73 | 4.10 | 3.86 | -0.09% |
| Industrial | 198 | 9.33 | 5.42 | 3.74 | 2.99 | -0.07% |
| Technology | 93 | 5.64 | 5.62 | 4.26 | 2.29 | -0.15% |
| Utilities | 51 | 2.89 | 5.55 | 4.50 | 3.26 | -0.17% |
Source: Bloomberg Terminal, Lighthouse Research
The communications sector was down by 48 bps this week. Altice (ATCEY), Numericable –SFR and Frontier (FTR) were the worst performers. They lost 3.5%-4.5%, 3.3% and 2.7% respectively. Altice bond declined due to weak revenue guidance made during a call with investors that raised concerns about the heavily leveraged company. We believe other communications bonds were under pressure due to overall UST effect because the industry has one of the highest levels of leverage among peers. Moreover, according to Bloomberg, Communications sector bonds, which represent almost 20% of the BB index, have among the tightest sector-level BB to BBB spread ratios, exceeded only by technology, and are tightest when comparing BB spreads to single Bs. Secular pressures are more evident in single B communications, which include Frontier, CenturyLink (CTL), Sprint (S) and Windstream (WIN).
The energy sector was the best performer this week. Energy bonds increased by 32 bps this week. Oil prices have been rising since June, supported by supply cuts led by OPEC producers and other countries such as Russia. As a result, oil price almost achieved three-year high of $70 a barrel this week. Noble Holding (NE) and Pioneer Energy (PXD) gained the most among energy companies (6.6% and 5.9% respectively).
Bonds from other sectors followed UST benchmark and declined approximately in line with UST.
New issues on the U.S. High Yield market (January 8, 2018-
January 12, 2018)
We present new issues on the U.S. High Yield market last week in
the table below.
Figure 4. U.S. High Yield market new issues
| Company | Industry | Yield | Maturity | Credit rating (S&P/M/F) | Net Debt/EBITDA LTM | CUSIP |
| CSC Holdings | Communi-cations | 5.3 | 2/1/2028 | BB-/Ba2/- | 4.8 | 126307AS6 |
| Moss Creek | Energy | 7.0 | 1/15/2026 | B+/-/- | N/A | 61965RAA3 |
| Ensco (ESV) | Energy | 7.5 | 2/1/2026 | BB-/B3/- | 4.6 | 29358QAH2 |
| Marb Bondco (Marfrig (OTCPK:MRRTY) subsidiary) | Food | 7.1 | 1/19/2025 | B+/-/BB- | 4.4 | 566007AB6 |
| Aramark Services (ARMK) | Consumer Services | 4.8 | 2/1/2028 | BB/Ba3/- | 14.2 | 038522AQ1 |
| Ingevity Corp (OTCPK:NVGT) | Chemical | 4.5 | 2/1/2026 | -/BB/Ba3 | 1.6 | 45688CAA5 |
| Sunoco (SUN) | Energy | 4.5 | 1/15/2023 | BB-/-/BB | 7.3 | 86765LAH0 |
| Jabil (JBL) | Manu-facturing | 3.9 | 1/12/2028 | BBB-/Ba1/ BBB- | 1.0 | 466313AH6 |
| L Brands (LB) | Retail | 5.3 | 2/1/2028 | BB/-/BB+ | 2.2 | 501797AN4 |
Source: Bloomberg Terminal, Lighthouse Research
Thank you for reading!
BR,
Vladimir Nikulin
P.S.: We welcome your comments and suggestions on other things we can add to the HY report that we intend to publish on a weekly basis.