The thesis of this article revolves around two very important metrics Google (NASDAQ:GOOG, NASDAQ:GOOGL) uses. These metrics are paid clicks and cost-per-click (CPC). The paid clicks (clicks on advertisements) are growing at an increasing pace, which I see as the main catalyst for Google to grow at an accelerated pace. The CPC (revenue for each click) has been in decline for the last 5 years. My buy thesis for Google revolves around the fact that volume (paid clicks) is growing very fast, and I expect price declines measured in CPC, to stabilize. Subsequently, this will accelerate revenue growth. I will explain this in more detail in the article.
A quick overview of the Google segments
Google properties
Google properties is the primary source of revenue (70.9% in 2017) and consist of:
- Advertising revenue generated by Google Search through the Google website or toolbars.
- Other properties owned Google like Google Play, Google Maps, and Gmail.
- YouTube.
Mobile advertising, YouTube, and improvements in the advertising format drive growth in the segment.
Google network member properties
Google network member properties generated 16.0% of revenue in 2017. The revenue comes from advertisements on properties of Google members. It consists of:
- Adsense: advertisements on web pages.
- AdMob: advertisements on mobile applications.
- Double Click ad Exchange: a marketplace for buying and selling advertising.
AdMob is the current driver of growth in this segment.
Google other revenues
Google other revenues consisted of 13.0% of income in 2017. The other revenue segment contains:
- Google Play store.
- Fees for cloud, apps, and Maps.
- Licensing revenue.
- Google-branded hardware.
Google Cloud, hardware sales, and in-app purchases drive revenue growth in this segment.
The Cost-Per-Click and Paid Click Metric Definitions
Before I delve into the numbers, a clear definition of the two metrics discussed is very useful. The following definitions are provided by Google in the Q3 2017 quarterly report:
Paid clicks for our Google properties represent engagement by users and include clicks on advertisements by end-users related to searches on Google.com, clicks related to advertisements on other owned and operated properties including Gmail, Maps, and Google Play; and viewed YouTube engagement ads like TrueView (counted as an engagement when the user chooses not to skip the ad). Paid clicks for our Google Network Members' properties include clicks by end-users related to advertisements served on Google Network Members' properties participating in AdSense for Search, AdSense for Content, and AdMob. In some cases, such as programmatic and reservation based advertising buying, we primarily charge advertisers by impression; while growing, this represents a small part of our revenue base.
Cost-per-click is defined as click-driven revenues divided by our total number of paid clicks and represents the average amount we charge advertisers for each engagement by users.
Google reviews the metrics periodically and recently made some changes. I think these changes don't affect the overall trend but should be mentioned either way. From the Q3 quarterly report:
In the first quarter of 2017, we refined our methodology for paid clicks and cost-per-click to include additional categories of TrueView engagement ads and exclude non-engagement based trial ad formats. This change resulted in a modest increase in paid clicks and a modest decrease in cost-per-click.
The company adjusted the numbers in 2016 to reflect this. The trend I provide might show some discrepancies in the 2016 numbers for this exact reason.
Google Paid Clicks
Google reports paid clicks on a year over year and quarter over quarter growth basis. I have reported both in Table 1 below. The table reports results for Google Properties, Google Members, and Google (Google Properties and Google Members combined). To have a good understanding on year over year growth it is good to focus on the bold Q4 numbers. For instance, Google paid clicks grew 43% in Q4 2017 compared to Q4 2016. The right side of the table shows quarter over quarter growth. Paid clicks for Google increased 18% in Q4 2017 versus Q3 2017.
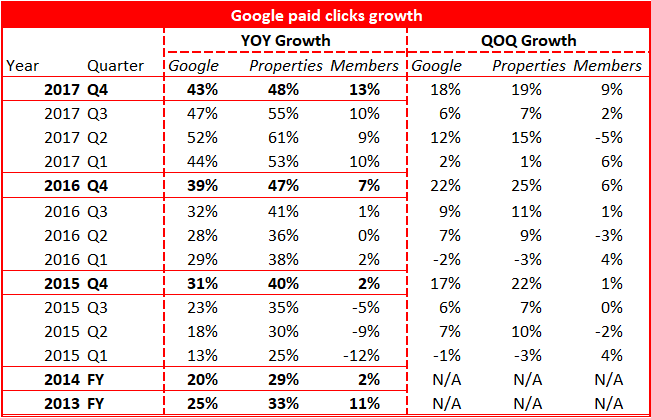
Table 1: Google paid clicks growth.
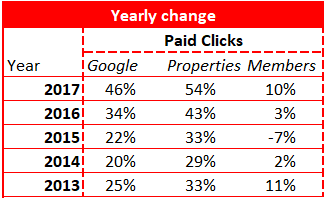
The real yearly changes slightly differ from the table above because the table reports quarterly year over year change. The real yearly change is reported below (Sourced from Google's 10-K reports.)
I personally like to visualize numbers to get a better understanding of the underlying trend.
Figure 2 shows year over year paid clicks growth and figure 3 details the quarter over quarter paid clicks growth.
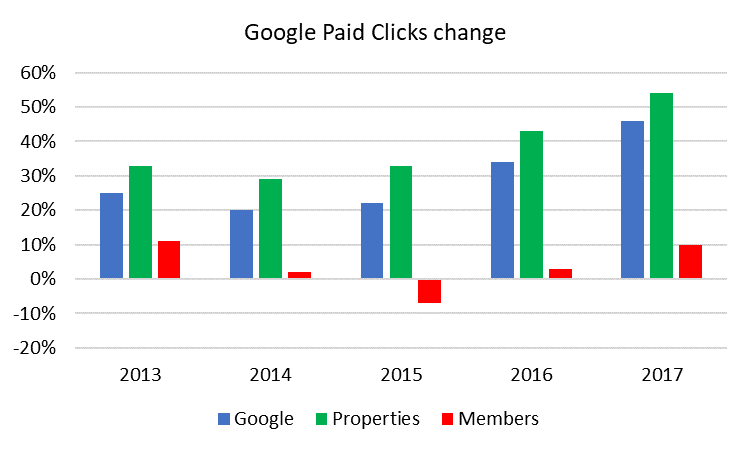
Figure 2: Google Paid Clicks YOY growth
Paid clicks growth for Google and Google properties has been very strong since 2013. The growth started accelerating in 2014 and hasn't stopped since. In 2017 paid clicks grew 46% for Google and 54% for Google properties. The growth of Google network members has been lagging the growth of Google properties. The growth for network members is 10% in 2017 after 3 years of growth under 10%. Google is better at generating click growth than it''s members.
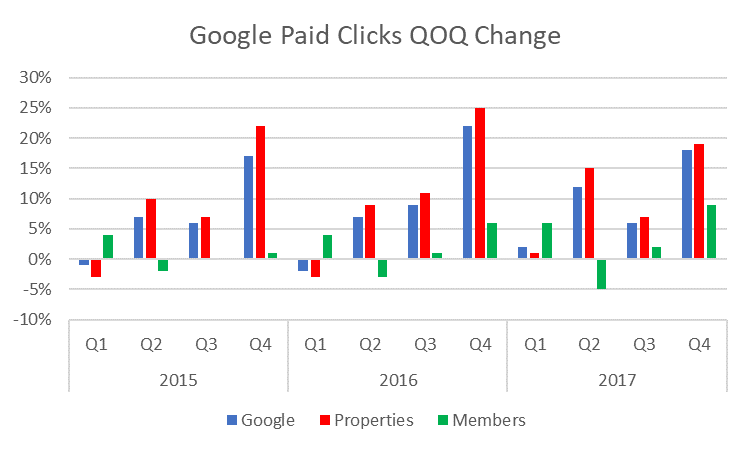
Figure 3: Google Paid Clicks QOQ growth
On a quarterly basis Google generates very strong growth in the fourth quarter. The growth then stabilizes in the first quarter and resumes in the second quarter. The growth in Q4 2017 seems to lag growth numbers in Q4 2016 and 2015. However, keep in mind Google did a lot better in Q1 and Q2 2017 compared to the prior years. I won't pay too much attention to the quarterly growth. My only take away is not to expect a lot of growth in Q1 2018 vs Q4 2017.
Google CPC
Google reports CPC in the same way it does paid clicks, and so do I. Table 2 provides the numbers for the change in CPC over the last years, figures 3 and 4 visually represent these numbers.
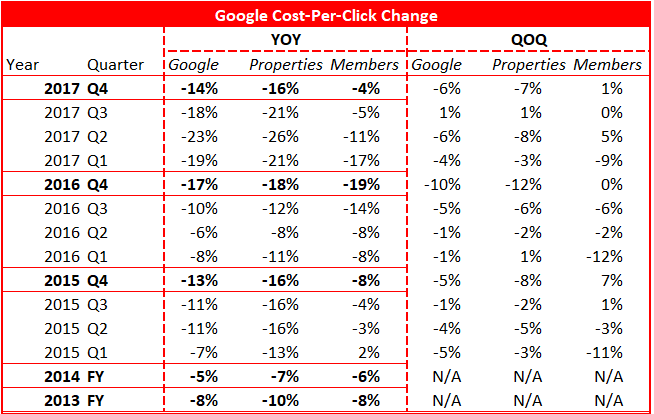
Table 3: Google CPC growth on a quarterly basis
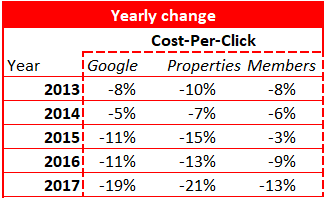
Table 4: Google CPC growth on a yearly basis
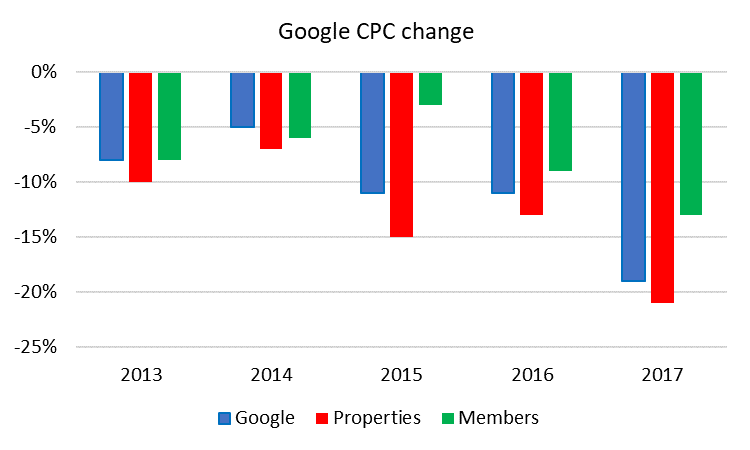
Figure 3: Google CPC year over year change
The CPC for Google has been in decline for the last 5 years. The decline is largely attributable to the growth of YouTube engagement adds (Source: Google 2017 10-K). Therefore, declines in Google properties CPC are larger than its network member peers. I expect that the decline in CPC will stabilize and see lesser declines in the coming years. My reasoning for this is that YouTube can only have so much effect on the CPC and the CPC will bottom out, more on this later.
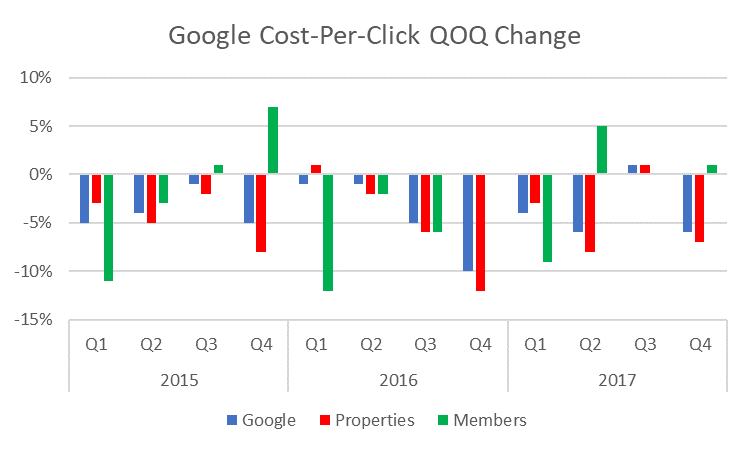
Figure 4: Google CPC quarter over quarter change.
Paid clicks and CPC trends
Table 5 and 6 report YOY change and cumulative change for the years 2013-2017 on Paid Clicks, CPC and CPC * Paid Clicks. The metric of CPC * Paid Clicks is essentially the revenue growth from advertisements.
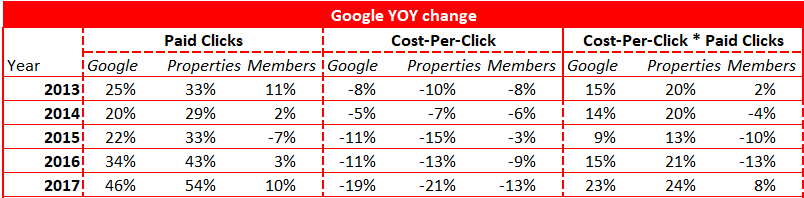 Table 5: Google year over year change trends
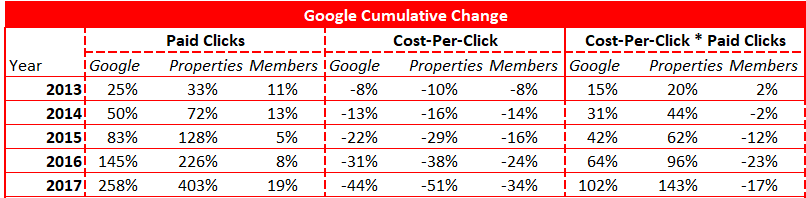 Table 6: Google cumulative change trends
Both tables show a huge increase in paid clicks for the Google and Properties segments. Google members have a harder time to grow the number of clicks as stated before. I assume paid clicks for properties will keep on growing due to growth in YouTube and search. Furthermore, the advertisement spending is expected to keep on growing for Online Video and Search (see figure 5). I expect a consolidation in the decline of CPC. From table 6 we can deduce that the price for a click on Google properties declined 51% in 5 years. YouTube is expected to experience the fastest growth based on the data in Figure 5. However, a lot of growth from YouTube is already reflected in the lower CPC. When Google is able to stabilize the CPC it obtains through YouTube I expect the decline in CPC to stabilize.
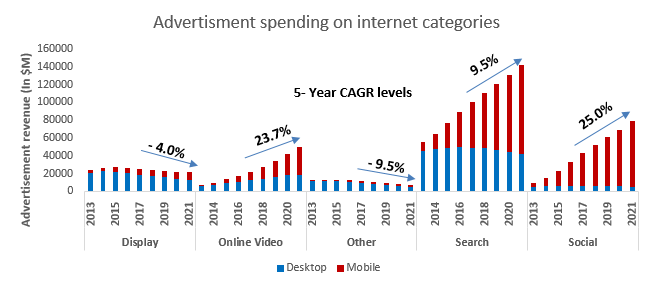 Figure 5: CAGR for internet advertising segments (Source: Magna Global)
Conclusion
Google is seeing very strong growth in its paid clicks, partially offset by declines in the CPC. The decline in CPC is largely driven by the growth of YouTube. It gives me confidence that the decline in CPC is due to a change in product mix and not necessarily a decline in the products. The lower CPC for YouTube is increasingly reflected in the total CPC and as a result, I expect the declines to dampen. Subsequently, this will increase revenues for Google properties.