Seasoned investors remember the old Anheuser Busch Company as a staple of 70's and 80's growth and income portfolios, a reliable company right there with IBM (NYSE: IBM), General Mills (NYSE: GIS), Procter & Gamble (NYSE: PG) and the other golden oldies. Times change and so did Anheuser Busch, morphing into today's Anheuser Busch InBev SA/NV (BUD) - what a mouthful - a sponsored ADR! The Clydesdales aren't even American anymore!
SOURCE: anheuser-busch.com
How the mighty have…changed.
What is BUD These Days?
Today's BUD is the product of two major beer brewery mergers. On November, 18, 2008, Belgian-Brazilian brewer InBev completed a $52.0 billion hostile acquisition of the Anheuser Busch Company creating the largest beer company in the world. On October 10, 2016, the new Anheuser-Busch InBev acquired SABMiller, the world's second largest brewer, for $107.0 billion.
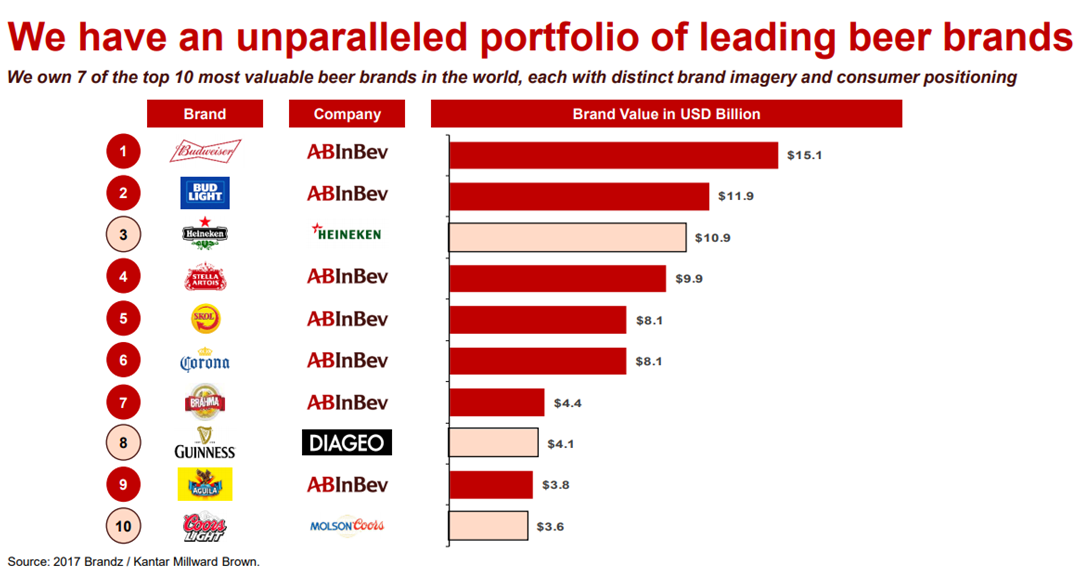
The new BUD is the industry's Clydesdale. With beer production of over 600 million hectoliters (1 hectoliter = 100 liters), BUD accounts for roughly 26% of the worldwide beer market. The company's reach is worldwide, selling more than 500 beer brands in over 150 countries. According to The Drinks Business per data provided by Euromonitor International, BUD owned 5 of the top 10 selling brands in the world in 2016 including Corona, Brahma, Harbin, Budweiser and Bud Light. As noted on the following chart, Kantar Millward Brown's brand equity ranking BrandZ, ranks 7 of BUD's beer brands among the top 10 most valuable in the world.
SOURCE: 2017 AB InBev Annual Report
There has never been a beer company with the global sales, operations and multitude of brands of the current BUD.
The company is headquartered in Leuven, Belgium and employs more than 200,000 in administrative and brewing operations in more than 50 countries. With annual revenue of $56.4 billion and a market cap of $172.4 billion per FactSet, BUD is in the same approximate market cap range as Comcast (NASDAQ: CMCSA), Mastercard (NYSE: MA) and Coca Cola (NYSE: KO).
SOURCE: ab-inbev.com
Today's BUD is the beer industry Clydesdale with worldwide operations and powerful, valuable brands that dominate major markets with near-monopolies, but no market is static. What is happening in the worldwide beer market?
The Worldwide Beer Market
To put it bluntly; as measured by volume of beer consumed globally, the beer industry is in a slow protracted decline. According to International Wine and Spirits Research ("IWSR"), an industry research group quoted in the Financial Times, worldwide beer sales fell 1.8% in 2017, compared with a five-year average decline of 0.6%. On a volume basis over time, the drop has been especially pronounced in developed countries like the U.S. and Germany as demonstrated by the IWSR chart below from Economist.com
SOURCE: Economist.com
It is important to differentiate between beer sales in volumes - generally liters or hectoliters - and in currency. Sales denominated in currencies, e.g., dollars, are subject producer-driven and generalized inflationary price increases and consumer substitution of higher priced beers for lower priced beers. To a lesser extent, currency exchange rate fluctuations may also distort the data. For years, the counter-trend to both declining volume and currency denominated sales was rapid growth in more expensive craft beers. Consumers have been trading up to higher quality, more expensive IPAs, lagers and stouts, but that trend has slowed. Per Nielsen, specific to the U.S. market:
Up until recently, the real opportunity in the beer category has been in the craft sub-category. Specifically, dollar sales growth in the craft realm ranged between just over 15% to just over 18% from 2013 through early 2016, well above the 1.3%-3.5% posted by the overall beer category (excluding flavored malt beverages, ciders and seltzers). For the year ended Jan. 28, 2017, however, the craft engine slowed significantly, with dollar sales growth of just 2.9% in Nielsen-measured off-premise channels.
Although growth has slowed, if you think the craft beer movement was a passing fad, consider that there are more than 5,000 breweries in the U.S., up from perhaps 100 in the early 1980's. The other counter-trend has been growth in developing nations. According to Rabobank Global Strategist Stephen Rannekleiv:
Looking forward, there will be moments where individual EMs disappoint, but the long-term overall outlook for volumes and value growth in emerging beer markets remains favorable.
In developed nations, the future of beer might very well be a return to the past; local, specialized, craft brewed on site in small batches, served with good food and shared with your neighbors. The Grain & Grit Brew Pub, Hamilton, Ontario, Canada in the photo below exemplifies the trend.
SOURCE: hoppily-ever-after.com
In developed nations, the industry faces a future where revenues in currency will continue to grow as consumers opt for higher quality over quantity and via generalized inflationary price increases, but volumes sold will decline. In developing nations, the beer industry will seek to tap growth in both volumes and revenue. Major brewers like BUD will continue to upscale their brands and penetrate emerging markets searching for a path to continued growth.
2017: The "New" BUD's Financial Performance - Not Frothy, Not Flat
Almost hidden behind the giddy "We Are The World" motif of the 2017 Annual Report - this is, after all, just a beer company - are some pretty impressive numbers, but first you have to wade through lots of dreck like this:
SOURCE: 2017 AB InBev Annual Report
"We are creating more occasions to bring people together." No, you're just brewing and selling beer. BUD's "Commercial Narrative" accompanying the 2017 Annual Report wastes an inordinate amount of space discussing the company's "Dream-People-Culture" platform, volunteering, disaster response, environmental and community sustainability, smart drinking, workplace safety and business ethics; all laudable objectives, but is BUD a for-profit business or a non-profit NGO?
2017 is the first full year investors can judge the "new" BUD's operations including SABMiller, but we will have to wait until year-end 2018 to judge BUD on comparable post-acquisition financial statements. However, in the 2017 Annual Report management presents combined pro forma numbers ("Normalized") as if SABMiller was consolidated as of January 1, 2016, excluding non-recurring items and discontinued operations, allowing an apples-to-apples post-acquisition comparison up to EBIT. Unfortunately, the SABMiller acquisition renders unadjusted comparisons virtually meaningless.
The comparison of the 2016 Reference Base (the normalized numbers) to 2017 Actual shows excellent progress in revenues, up 4.6%, gross profit, up 7.0% and EBITDA, up 12.5%. The gross margin increased from 60.8% in 2016 to 62.1% in 2017 as revenue growth of 4.6% outpaced the 1.0% increase in cost of sales.
In the 2017 Annual Report, management highlights 5.1% "organic" growth in revenues compared to the 4.6% above. The difference results from the company's presentation of non-GAAP/ non-IFRS measures that attempt to isolate the impact of major changes in operations and currency fluctuations from the base business. To that end, the table on the following page from the 2017 Annual Report breaks down selected numbers into three components:
- "Scope" which represents the impact of acquisitions and divestitures, the start-up or termination of activities or the transfer of activities between segments, curtailment gains and losses and year-over-year changes in accounting estimates and other assumptions that management does not consider part of the underlying performance of the business.
- "Currency translation" which means the impact of changes in exchange rates and values of currencies on foreign operations.
- "Organic" which means the underlying base business excluding the above two components.
On this basis 2017 performance looks even better with year-over-year "organic" growth in revenue (5.1%), gross profit (6.7%) and EBITDA (13.4%).
SOURCE: 2017 AB InBev Annual Report
The very slight organic growth in volumes of 0.2%, however, which merits further analysis, highlights the fact that BUD's increase in revenues is almost completely the result of selling more expensive beer, what the company calls "premiumization."
The Basics: EPS, Dividends, ROA and ROE
"Normalized" EPS increased 42.8% from $2.83 in 2016 to $4.04 in 2017 primarily due to the 5.1% "organic" increase in revenues combined with a 2.6% reduction in "organic" cost of sales. Dividends for the 2017 year are expected to be €3.60 or approximately $4.34 per share, depending on the exchange rate impact on the proposed final 2017 dividend of €2.00. If the final proposed dividend for 2017 is paid as management suggested, the payout ratio for the year will be roughly 107.4%. This is the point where everyone relying on dividend income asks: Is the dividend safe? The table below shows that in 2017, with all the static from the SABMiller acquisition, there was still about $1.4 billion in free cash flow after the dividends were paid.
However, dividend growth going forward is expected to be "modest." This is the fourth Capital Allocation Objective from the last slide presented with the 2017 Earnings Conference Call.
Our goal is for dividends to be a growing flow over time in line with the non-cyclical nature of our business. Given the importance of deleveraging, dividend growth is expected to be modest.
The "growing flow over time" must have been translated from Dutch.
Two traditional measures of corporate performance, ROA and ROE, are worth mentioning to determine if BUD was on track in 2017. Once again, the SABMiller acquisition makes comparison a bit difficult, but rough calculations of BUD's 2017 ROA and ROE yield 3.7% and 11.4%. For comparison, FactSet is reporting ROA and ROE for Molson Coors (NYSE: TAP) on a trailing four quarters basis of 4.7% and 11.3%.
TAP's higher ROA and similar ROE suggest a question regarding BUD's debt. BUD had a year-end debt / equity ratio of 130.1% compared to TAP's trailing four quarters number of 85.5%, yet TAP's ROE was almost identical to BUD's. Ceteris paribus, higher leverage should produce a higher ROE. Time to examine BUD's debt.
Lots and Lots of Debt
At the end of 2017, BUD had a mountain of debt on its balance sheet due largely to the SABMiller acquisition. Net debt (short and long-term debt less cash & cash equivalents and other adjustments) totaled $104.4 billion or 130.1% of equity.
BUD's stated optimum capital structure per the Capital Allocation slide from the 2017 Earnings Conference Call is net debt / EBITDA of 2.00 compared to year-end 2017's 4.73. EBITDA / interest expense of 3.39 is on the low side as well, but the company's debt is rated A3/A- by Moody's and S&P, respectively. The company's debt is also spread across its maturity schedule with a significant and beneficial 93% fixed rate in what increasingly looks like a rising rate environment.
SOURCE: 2017 AB InBev Annual Report
The company is committed to deleveraging to around the 2.00 level for net debt / EBITDA, in fact, this is one of BUD's Capital Allocation Objectives. As a down payment on this objective, the company paid down about $6.2 billion in current and long-term interest-bearing loans and borrowings in 2017. Realistically, in spite of the huge debt incurred in the SABMiller transaction, no one expects BUD to have debt issues.
However, at this point, it does not appear that the additional leverage on the balance sheet from the SABMiller acquisition is paying off in terms of higher returns to shareholders. See the "2018: Brewing Synergies" section of this article.
Volumes Speak Volumes
Against the strong headwind of declining worldwide beer sales in 2017 BUD managed to eek out a small 0.2% gain in volumes sold. Note that "Scope" for the EMEA region in the following table largely refers to brand divestitures required by regulatory authorities in connection with the SABMiller acquisition. What is troubling, however, is the 3.3% decline in organic growth in the U.S. The U.S. market, after all, is home to key brands Budweiser and Bud Light.
SOURCE: 2017 AB InBev Annual Report
Most of BUD's volume growth has been driven by global brands (Stella Artois, Corona and Budweiser) sold outside their home countries and increased market penetration in developing nations. The only operational regions with seemingly healthy organic volume growth in 2017 were Latin America West with 1.7 million (1.6%) hectoliters and Latin America South with 1.9 million hectoliters (5.9%). Much of BUD's EMEA volume growth of $1.0 million hectoliters (0.9%) came from Africa. According to the Financial Times:
Africa is the world's fastest-growing beer market, with research group Plato Logic forecasting volume growth of 4.5 per cent this year compared with 1.4 per cent per cent globally.
No other region approached 1.0% volume growth. For comparison purposes TAP reported a 1.0% worldwide increase in volumes sold for 2017.
Beer companies are fighting several battles in terms of sales:
- Aging populations - in the developed nations most notably, but worldwide - drink less beer.
- All age cohorts in certain developed nations are to some degree substituting wine and spirits (e.g., the U.S. cocktail craze, single malt whiskeys, fine wines, etc.) for beer.
- Alcohol is being consumed less per capita worldwide including formerly strong beer markets Russia, Brazil and China.
- In developed nations consumers are turning to local quality brews - craft beers.
- Health concerns, e.g., the "beer belly."
- Increasing taxation and regulation
According to Hector Gorosabel, CEO of Asahi Europe as quoted in beveragedaily.com:
We have traditionally survived on volume. Volume is not the way to win anymore.
To offset these trends, one weapon BUD wields is the Category Expansion Framework, a type of beer market segmentation strategy that was in use at SABMiller.
SOURCE: 2017 AB InBev Annual Report
The strategy is built on "Core Lager" which is broken down into easy drinking and classic styles. From there, in mature well-off markets, consumers are offered premium beers. In less mature, poorer markets consumers are offered affordable beers. Flavored beers are seen as an extension of easy drinking styles and other beer styles are specialized beers, hefeweizen, for example. Each type of beer is introduced into appropriate markets when the time is seen as right. In essence, the Category Expansion Framework provides a way to think about beer brands relative to different markets or, alternatively, it made some consultants who restated the obvious with nifty charts a lot of money.
2018: Brewing Synergies
With overall volume growth stalled as declines in North America and Europe are largely offset by gains in developing nations and revenue growth increasingly tied to "premiumization," BUD's future is as hazy as an unfiltered craft-brewed IPA. One thing is clear, however, and that is that significant earnings gains for BUD over the next 2-3 years will come from post SABMiller-acquisition cost-cutting or the realization of "synergies." Management expects $3.2 billion in run rate reductions in expenses from cost-cutting over the next 2-3 years, partially offset by $1.0 billion in additional acquisition-related expenses (severance, plant closures, etc.) over the same period.
SOURCE: 2017 AB InBev Annual Report
As the chart demonstrates, management has been disciplined about the realization of the synergies identified before the SABMiller acquisition. At the time of the acquisition, it was widely noted that the combined company was planning to reduce its workforce by 3% or about 5,000. Recent evidence of ongoing cost cuts was the September 2017 termination of 380 salesforce employees in the High End (premium craft beer) division.
BUD can play "inside baseball" in 2018 and show strong earnings growth. For example, if "just" $500.0 million in synergies were realized in 2018 at the company's 25% tax rate per guidance, net income would increase about 4.0% on cost-cutting alone.
The company provided very general guidance for 2018 earnings:
- "Strong" revenue and EBITDA growth via various brand initiatives with net revenue per hectoliter exceeding inflation through premiumization / revenue management and expenses increasing less than inflation.
- $1.0 billion in SABMiller acquisition synergies to be captured over 2-3 years.
- Average 2018 debt coupon of 3.7%.
- Net pension interest and accretion expenses of $30.0 and $100.0 million per quarter, respectively.
- Normalized effective tax rate of 24% to 26%, excluding any potential gains or losses on hedging.
- Capital expenses of $4.0 to $4.5 billion.
- Optimal capital structure remains 2.0 net debt to EBITDA ratio.
- Dividends to be a "growing flow over time," but short-term growth expected to be "modest" due to an emphasis on deleveraging the balance sheet.
Sell-side analysts are largely bullish about 2018 for BUD. The average earnings estimate per Thompson Reuters is $5.09 per share a 26% increase over 2017's $4.04 per share. Clearly analysts are expecting the positive trends in revenues, costs and margins to continue through 2018. The 26% increase in earnings would bring BUD's ROA to approximately 4.6%, right in line with TAP's, and ROE to over 14% - better, but still somewhat anemic given the company's leverage. The average price target is around $130.0 per share, suggesting 17% upside from a recent $111.0 per share. If dividends per share remained flat at about $4.34 per share this would imply a moderation of the payout ratio to roughly 85%.
Dividends and Taxes
This discussion does not substitute for consultation with your own tax advisor.
Taxes on dividends are always a consideration when considering the purchase of a foreign-based company's stock. BUD's cash dividends paid to U.S. resident ADR holders are subject to a 15% withholding tax per a tax treaty under Belgian law as of January 1, 2017. If you file IRS Form 1116, you can claim the full 15% withheld as a foreign tax credit against any income tax you pay in that year.
Conclusion
BUD is working off the hangover of the SABMiller acquisition. Things are a little hazy, but are becoming much clearer. Strong core brands, premiumization, growth in emerging markets, category expansion, near monopoly status in certain regions and realization of synergies will chart a path to improved profitability and performance over 2018 and beyond. But is that enough in an industry facing significant challenges?
In the short term, with a dividend yield of about 3.7%, only modest growth expected and a Form 1116 to file, the dividend-focused investor may be disappointed. BUD offers a better fit for the growth and income investor with an acceptable dividend yield and clarity regarding possible growth catalysts for the future. A very valid consideration for all investors is that companies selling any form of alcohol have proved to be resilient in the face of recessions and market downturns.
SOURCE: healthland.time.com
You have to take what the market gives. Although Herding Alpha is long BUD between $104.0 and $105.0 per share, it is not my favorite company in the spirits, wine and beer category. Right now, however, at $111.0 - $113.0 per share BUD merits consideration as an addition to your portfolio. There are significant bottled-up catalysts that should pour out over the next year to produce combined capital appreciation and dividends exceeding the alternatives in the beer industry.