By Christopher Aaron
The US dollar has been rising in a counter-trend rally since mid-April, up nearly 6% on the dollar index over the past five weeks on speculation that the Federal Reserve will again raise interest rates at the coming June 13 meeting. The uptick in the dollar has put pressure on gold. As we can see from the chart below, over this same period gold has fallen by nearly 5%, down to $1,303 as this article goes to press.
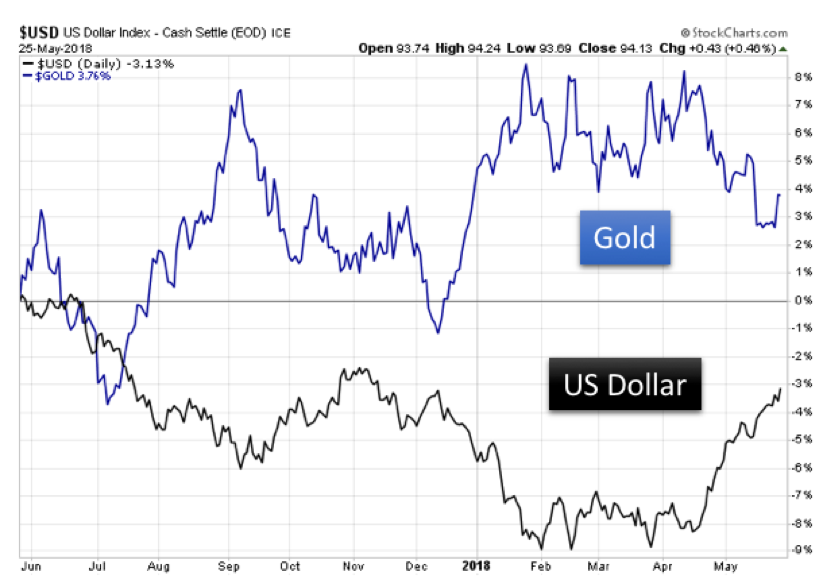
Chart courtesy: StockCharts
The general inverse correlation between the dollar and gold is relatively plain to see over the past year. However, we caution gold investors to be wary of placing too much emphasis on the US dollar price action in attempting to gauge long-term trends in precious metals.
Increased Perspective
Below we examine the same US dollar index, with the price of gold immediately below it. We present data from the freely-traded era; in other words, after gold and world currencies were free to float against one another following the breakup of the Bretton Woods Accord in 1971:
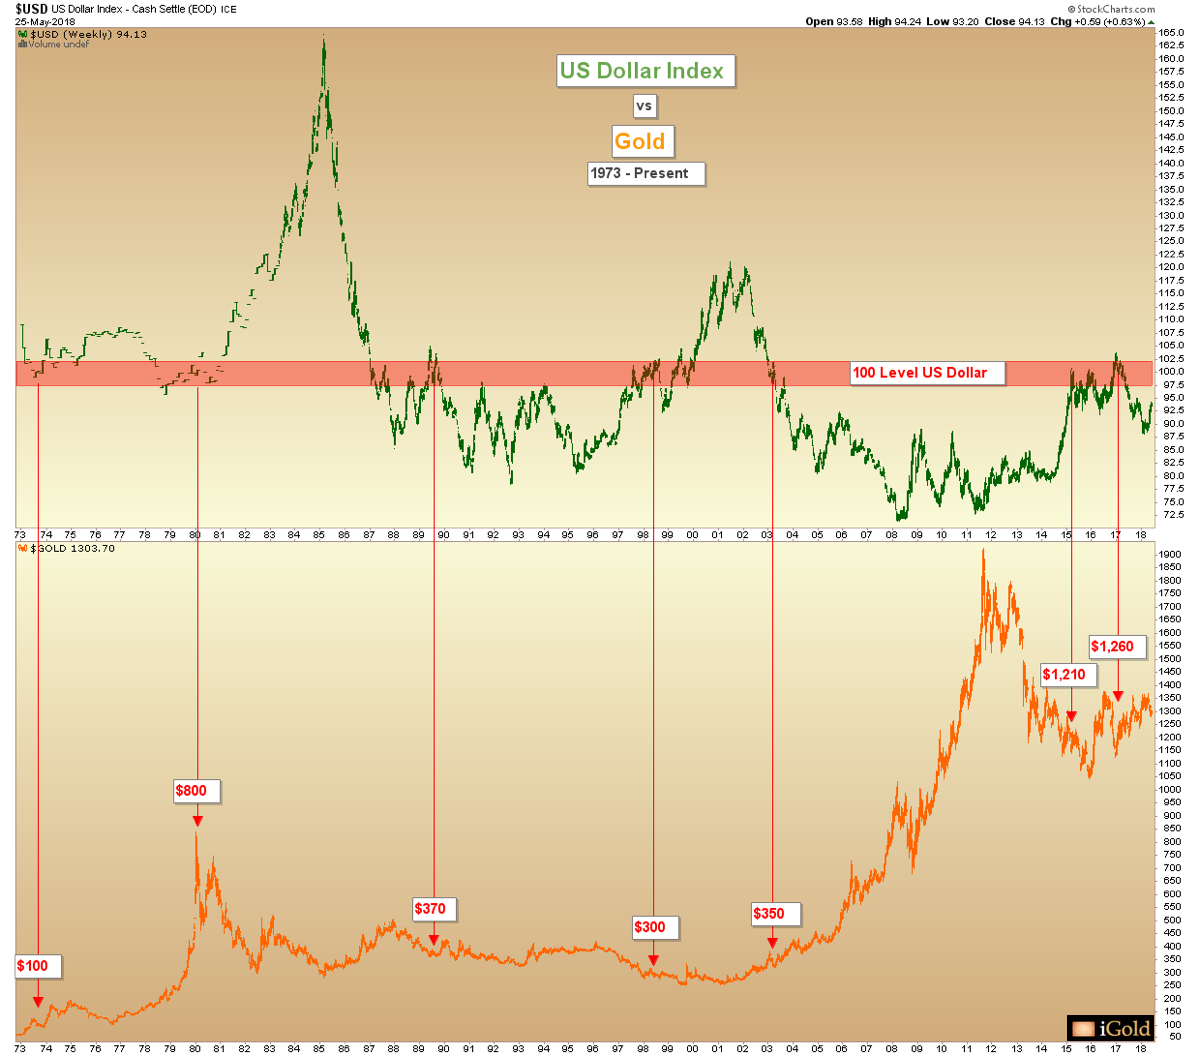
Chart courtesy: StockCharts
Let us examine a neutral reading for the dollar of 100 on the index. This is highlighted above in red. Note how throughout time, the 100 reading on the dollar index has corresponded with the following prices for gold:
- 1973 - $100
- 1980 - $800
- 1989 - $370
- 1998 - $350
- 2015 - $1,210
- 2017 - $1,260
What are we to make of these diverse readings on the gold price corresponding to the 100 level on the index? Shouldn’t gold move inversely to the dollar as shown on the first chart?
Dollar Index Fails As a Long-Term Determinant
The bottom line is that the dollar index is a faulty gauge by which to predict gold prices