Manchester United (NYSE:MANU) is a UK-based company representing a world class soccer club with the same name (also nicknamed as 'The Red Devils').
 Source: Mirror
In my previous article on Manchester United, I identified the different sources of its revenue and discussed the factors that could lead to growth. In this article, I have discussed the reasons for decline in MANU's revenue in 3Q 2018 compared with 2Q 2018. As the 4Q is underway, I have highlighted the factors that in my opinion are likely to result in a decline of revenues and earnings going forward. However, because I believe that the dynamics of a sporting club require it to be viewed in a broader perspective than the typical financial performance metrics, I have also discussed other factors that will help support the club's future.
3Q 2018 Performance Review:
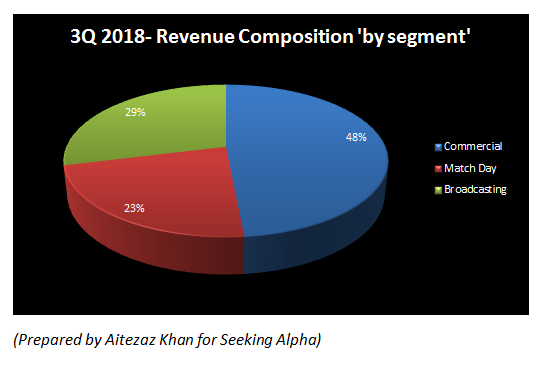
MANU's revenue for 3Q 2018 stood at £137.5 million which increased 8% YoY. However, it was down 16% from 2Q 2018 revenue, which stood at £163.9 million. MANU's revenue is generated from three major streams comprising of MD (read: Match Day), CMC (read: Commercial) and BDC (read: Broadcasting). In my previous article on MANU, I included a brief discussion of how revenues from these streams have evolved over the years. The chart below illustrates the relative portion of revenue from each segment:
 Additionally, I have tabulated a comparison of QoQ revenues to analyze the performance of these segments during 3Q 2018.
| Revenue Stream | 2Q 2018 (£ million) | 3Q 2018 (£ million) | QoQ Variance (%) |
| CMC | 65.4 | 66.7 | up 2% |
| MD | 36.9 | 31.1 | down 16% |
| BDC | 61.6 | 39.7 | down 36% |
It is evident that the major losers are MD and BDC revenues that have underpinned the slight growth in CMC revenues.
Comment on MD revenue decline: This