Tableau: What Makes It So Special?

Stefan Redlich
24.84K Followers

Summary

  • Tableau has seen strong growth over the last twelve months and its growth is poised to continue yet there is still a lack of understanding what makes Tableau so special.
  • Drawing on personal experiences with the software and the community I will outline my very strong long-term bull thesis.
  • Tableau's vision is visionary and its strategy execution and community engagement is state of the art.

After a stellar Q1/2018 the market has finally found its love for Tableau (DATA) with the stock rallying a monstrous 56% YTD and rising 27% compared to its pre-earnings closing.

Source: YCharts

Having crushed the psychological $100 barrier for the second time after its IPO the stock is closing in on its all-time high of around $130.

The financials are showing that the business is growing fast but I believe only when taking a user's perspective investors can truly understand the value Tableau offers and why its moat will reign supreme.

What makes Tableau so special?

Happiness: Tableau users are happy users as the software is intuitive, well-designed, powerful. The only limit is your own creativity. Here are three unique aspects about it

  1. In the pre-Tableau world everyone was only talking about charts and diagrams when it came down to visualizing data in business. Sure, there were very sophisticated infographics but those were neither easy to produce nor meant for dynamic reporting. With Tableau we are no longer viewing standard and overwhelmingly ugly Excel charts but instead we are looking at "vizzs", that is visualizations and the possibilities here are endless. Tableau Public hosts a gallery showcasing the most stunning visualization examples created by the community and Tableau employees. The breadth and depth here is truly staggering. Below is a viz that recently won a so-called "Iron Viz" competition (more on that later):

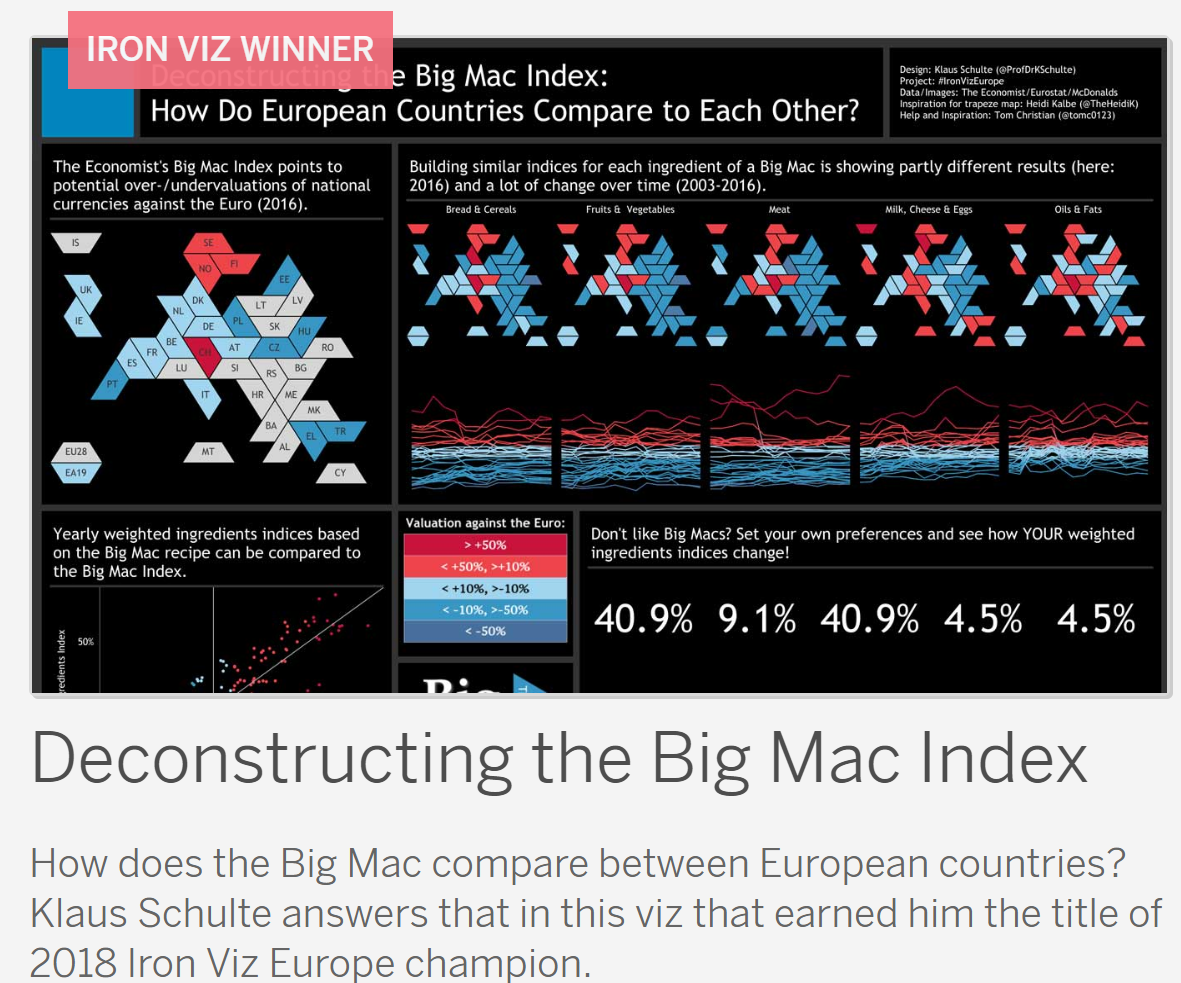
Source: Tableau Public Gallery

2. Tableau is intuitive. When I opened it for the first time (I have an analytical background and used Excel and PivotTables every day) it immediately felt like something where you just know how to start. You load your Excel data into, click around, drag and drop and quickly get a sense of how that is all working. And in case you have never ever got in touch with data or

This article was written by

24.84K Followers
I am working as a Business Analyst and Data Engineer in Germany and have started to build up a portfolio focused on Dividend Growth, both on the high and low-end yield spectrum. Primary focus is on Blue Chips with long-reaching dividend track records. I have been investing for 2 years and have been standing on the sidelines for way too long before. I love developing spreadsheets in Google and Excel to analyze financial performance and integrate these two sources with each other!Happy to connect on the various channels!

Analyst’s Disclosure: I am/we are long DATA, MSFT. I wrote this article myself, and it expresses my own opinions. I am not receiving compensation for it (other than from Seeking Alpha). I have no business relationship with any company whose stock is mentioned in this article.

Seeking Alpha's Disclosure: Past performance is no guarantee of future results. No recommendation or advice is being given as to whether any investment is suitable for a particular investor. Any views or opinions expressed above may not reflect those of Seeking Alpha as a whole. Seeking Alpha is not a licensed securities dealer, broker or US investment adviser or investment bank. Our analysts are third party authors that include both professional investors and individual investors who may not be licensed or certified by any institute or regulatory body.

Recommended For You

More on DATA