PHK: High Yield and A Hefty Premium
Yesterday, I discussed an overview of the 11 taxable-income, closed-end funds from PIMCO. In it, I said I'd be coming back to individual funds for a closer look. I want to start with a fund that I've not discussed previously other than in passing references: PIMCO High Income Fund (NYSE:PHK).
I'm starting with PHK for a few reasons.
First, I've owned the fund for a while. When I note that in my disclosure statements, I often get asked "Why?". Why own a fund with a massive premium, negative UNII, and a declining NAV? Legitimate questions all, and I hope to explain as we go on.
Another reason is that PHK is at the top of the pile for yield and market return. That has to be worth paying attention to, right?
Add to that the fund's huge premium and we begin to realize that this is far from a typical CEF.
All this combines to make it interesting to examine. Yet few observers of CEFs give it any attention at all. At best it gets dismissed as a yield-chaser's fund, with unsustainable distributions and valuations. Not that I necessarily disagree, mind you, and something any buy-and-hold investor will want to ignore. But I'm not convinced that these negatives disqualify the fund from consideration. I've made good money on PHK and I expect to do so again.
The Fund
PHK is a leveraged, multi-sector bond fund.
It carries 25.15% effective leverage. Preferred shares at 2.88% interest fill 9.2% of that, with the rest coming from reverse purchase agreements (12.9%) and credit default swaps (2.03%). In that mix it looks a lot like many of the other PIMCO funds with lower leverage than most.
As the name implies, the fund's objective is "high current income with capital appreciation as a secondary objective."
Its portfolio looks like this (from PIMCO).
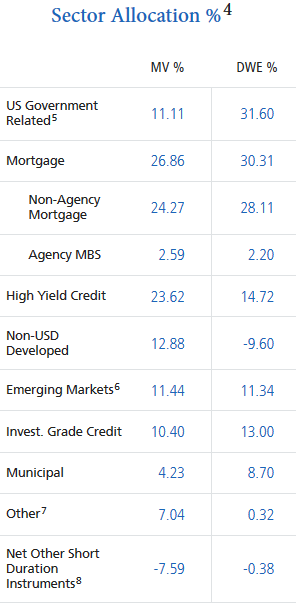
Let's review some of the fund's numbers and history.
Yield
The name of the fund tells us what's in the box: High Income. And it does deliver on that label. Its NAV distribution rate is 15%, second highest among 143 taxable-income funds listed at CEFConnect. Only Oxford Lane Capital (OXLC) pays out a greater share of its NAV (16.1%). PHK's market yield is 11.25%, fourth highest of the group, trailing only OXLC's 14.4%, Eagle Point Credit Company's (ECC) 13.0% and AGIC Convertible and Income Fund's (NCZ) 11.4% yields.
Here's a chart of PHK's Yield (NAV and Market Price) and its premium since 2009:

I'll be coming back to this chart, but there are a few things to note now. The fund has always paid a high distribution, above 10% for this time frame, and NAV distribution rate has ranged above the 20% on two occasions.
The fund has held a premium for this entire period (it dipped briefly and only slightly into a discount in 2015).
PHK's management held the distribution constant at $0.122 monthly through September 2015 when it cut it to $0.103 (-15.6%). It cut again in February 2017 to $0.081 (-21.4%). The cuts are obvious on the yield chart, and on the premium chart, we see it set off deep declines in the fund's premium.
Market vs. NAV Performance
There is another consideration that goes into investor willingness to pay high premiums for a fund: the fund's overall performance. This has an interesting feedback loop. If the fund is gaining value, investors flock to it, driving up prices. Nothing new here; that's how markets work. But in CEFs, the higher prices are most typically driving valuation changes: increases in the fund's premium or decreases in the discount. This has the effect of increasing market performance even if there is no change in NAV growth.
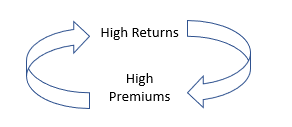
This can become a self-perpetuating cycle even in the face of a declining NAV because many investors look no further than market yields and market price performance when sizing up a fund.
Let's look at a chart of NAV, Market Price and Premium. Here you'll see that this feedback loop looks to be running now.
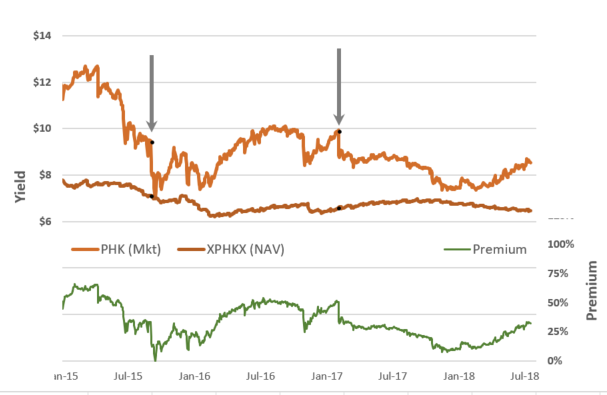
The arrows show the distribution cuts. For the 2015 cut, NAV and market price and premium had been in an extended downturn. The 2017 cut came after a period of market gains and a slight upward trend in NAV. After the first cut, NAV stabilized for a bit, then continued its decline. But at the time of the 2017 cut, NAV was well below its level at the first cut. It did begin to grow, which is what one would expect if the cut was working to make the fund more sustainable.
After a year of market price and premium declines, the trend turned around, and both began to gain. As it happens, NAV began dropping about this time and has continued a near-linear decline. Yet market price remains in a strong upswing. It's clear that those market gains have no relation to NAV; they are entirely gains in the premium. And, I submit these are driving one another through that feedback loop. It only takes a glance at the NAV chart to see there's little substance in those gains. But that doesn't mean they're not gains.
I opened with a set of questions I'm asked about why hold PHK. As I said, I agree with all the negatives. But I also see investor behavior at work here. That behavior is driving profits well out of proportion to the underlying fundamentals. Until it breaks.

The most likely trigger for that break is a distribution cut.
How Distribution Cuts Affect Shareholder Value
Let's return to those distribution cuts. Here's an annotated chart showing the dates of the announced distribution cuts and the changes in share price following those announcements.
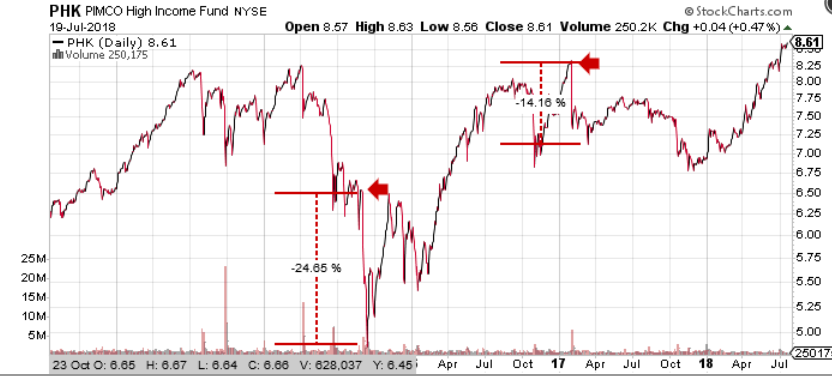
What we see is a double hit to shareholders from those cuts. First there the obvious cut to income: -15.6% in 2015 and then another -21.4% 18 months later (The next distribution announcement will come at the beginning of August, 18 months after the 2017 cut). Then, there are the sharp declines in share price we see in the chart. Because CEFs trade at market prices that are detached from their NAVs (unlike OEFs or ETFs), those prices can suffer outsized losses independent of changes in NAV.
When PIMCO cuts, it tends to cut deeply. Some CEFs will take regular small cuts as conditions demand. Others, PIMCO among them, hold off until the cuts are absolutely required. In this second case, the hit to shareholders is proportionately more severe.
What About Today?
If we take the position that investors are in the fund for the high yield to the extent that they are willing to pay high premiums for that high yield, two questions emerge:
1) Is the distribution at risk? Because if it is and it is cut, investors will bail and the price will collapse. That's not speculation; it's what happens whenever a high-premium fund cuts its distributions.
2) Are there better alternatives at the yield PHK provides?
I'm going to look at what clues we have to answer the first question. The second I'll not address today other than to remind you of three funds I noted in an earlier paragraph (OXLC, ECC and NCZ). Beyond that, I welcome your suggestions in the comments.
Is the Distribution at Risk?
This is a difficult question to answer, and getting it wrong can be an expensive choice. I'll turn to two measures of distribution sustainability to see if we can find some guidance. These are coverage ratio and undistributed net investment income (UNII), which I just reviewed for the PIMCO funds.
This next chart shows monthly values for the trailing three-month distribution-coverage ratios and monthly UNII for PHK since November 2014, a period that covers both distribution cuts and the months leading up to them. Is there a pattern?
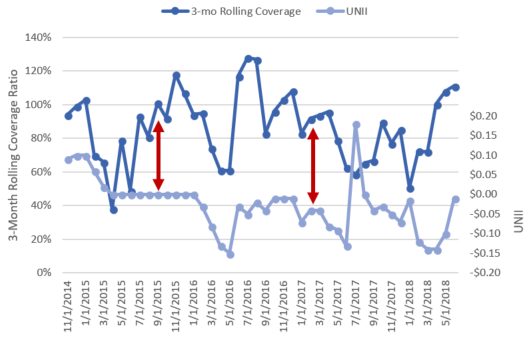
The red arrows show the announcement dates for the distribution cuts in 2015 and 2017. Five months prior to the 2015 cut, coverage had dropped to under 40%, but it was moving up, reaching over 90% for three months only two months prior to the cut. UNII was flat at zero for the five months leading up to the distribution cut.
At the time of the 2017 cut, the coverage had been moving between 80% and over 100% for six months. UNII was consistently negative.
Let's turn to the current situation. For the six months that include the most recent report (June 2018), coverage increased from 51% to what seems to be a healthy 111%. This would suggest that the distribution is safely covered and not at risk. Yet, UNII has been, and remains, negative. It has been on an upward trend from April through June.
It's difficult for me to draw any conclusions from these data on what we might expect for the August distribution announcement. But the pattern does resemble what the fund did in 2017 when coverage had moved into positive territory and UNII had begun to show a recovery from a month's long dip into negative territory. The big difference is that today's coverage has been above 100% for three months reporting, so it looks most like the month prior to the one preceding the 2017 cut.
From these data, I would say the distribution is not headed for another cut in the immediate future, but I would have said that in 2015, based on the recovering coverage ratio. If I'm right on that guess, what about down the line?
If that coverage trend continues to stay above 100%, I'd consider the distribution safe. But if it drops again, and especially if NAV continues to decline along with it, it would seem the managers will be forced to cut the distribution once again. If so, history tells us it will be another big, double digits for sure, cut. Since, as we've seen, the premium growth is driven by the fund's hefty distribution rate, it seems unlikely that another premium recovery will follow another cut in that rate.
Making the Call
My choices as a PHK long are to hold through another distribution cycle, assuming that there will be another month at the same level, then watch closely for next month's coverage report and do it all over again. Or take the safe road and exit now with a nice profit from this year's premium run-up.
Jeremy and Piece from Zits nailed it on Friday morning:
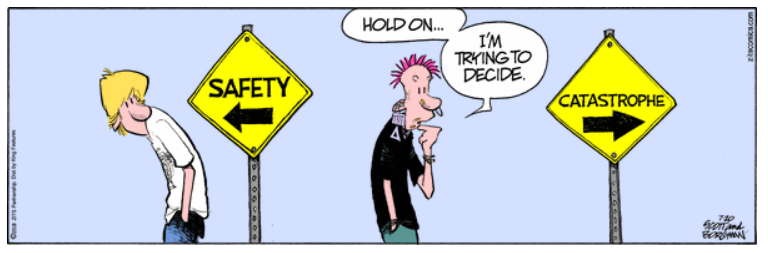
I'm with Jeremy. The prudent move on PHK right now is to take the safer path and avoid the prospects for catastrophe. On Friday, PHK's gain hit 20% more than the coming month's distribution (assuming no cuts). I cashed in.