Here are the weekly charts and key levels for the gold, commodities and dollar exchange-traded funds as the Turkey turmoil continues.
The gold trust ETF tracks the spot price of gold and is said to be backed by gold bars in vaults in London.
SPDR Gold Trust (NYSEARCA:GLD)
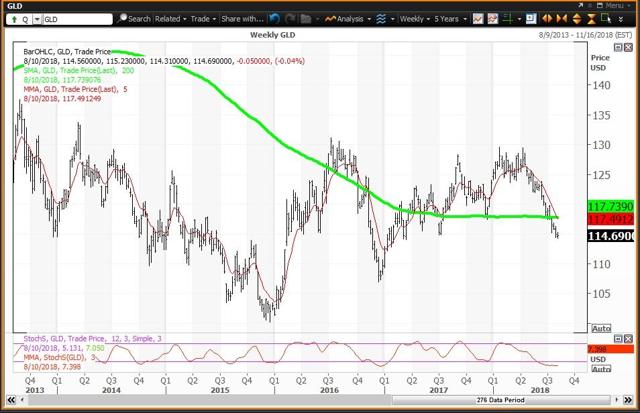
The Gold ETF ($114.69 on Aug. 10) is down 7.2% year to date and its weekly chart is negative but oversold with the ETF below its five-week modified moving average at $117.49 and below its 200-week simple moving average or ‘reversion to the mean’ at $117.74. GLD set its 2018 low of $114.31 on Aug. 6. The 12x3x3 weekly slow stochastic reading fell to 07.40 last week below 10.00 as an indication that gold has become ‘too cheap to ignore’ particularly given the uncertainties of the Turkey turmoil.
Investor Strategy: Buy weakness to my quarterly and semiannual value levels of $113.60 and $103.62, respectively, and reduce holdings on strength to my monthly risky level of $123.44.
The commodity ETF is heavily-weighted to energy by about 60%.
iShares S&P GSCI Commodity-Indexed Trust ETF (NYSEARCA:GSG)
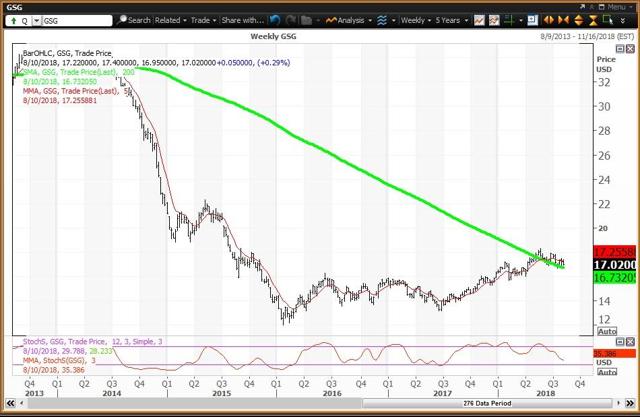
The Commodities ETF ($17.02 on Aug. 10) is up 4.5% year to date with a negative week chart with the ETF below its five-week modified moving average of $17.26 and slipping down, but just above its 200-week simple moving average which is the ‘reversion to the mean’ at $16.73. The 12x3x3 weekly slow stochastic reading declined to 35.39 last week down from 38.19 on Aug. 3.
Investor Strategy: Buy GSG on weakness to my quarterly and annual pivots of $16.25 and $16.20, respectively, and reduce holdings on strength my monthly risky level of $18.46.
The US Dollar ETF is a basket of currencies that includes the dollar vs. euro, Japanese yen, British pound, Canadian dollar, Swedish

