Elliott R. Morss © All Rights Reserved
Introduction
Financial pundits regularly remind us that the US stocks are high and an adjustment will come “soon.” In these circumstances, I make sure I am getting a good dividend/interest return for the stocks I hold. In addition, I regularly look to emerging markets for investments. In a recent piece, the McKinsey Global Institute looked at “high-growth emerging economies and the companies that propel them.” It noted that emerging economies have accounted for almost two-thirds of the world’s GDP growth and more than half of new consumption over the past 15 years.
Using World Bank data, McKinsey found that seven economies achieved or exceeded real annual per capita GDP growth of 3.5% for the entire 50-year period, while a second group of 11 achieved real average annual per capita GDP growth over the last 20 years of at least 5%.
In what follows, I use my own measures to examine these 18 countries and ask whether any of them warrants investments.
Analysis
a. Growth Measures
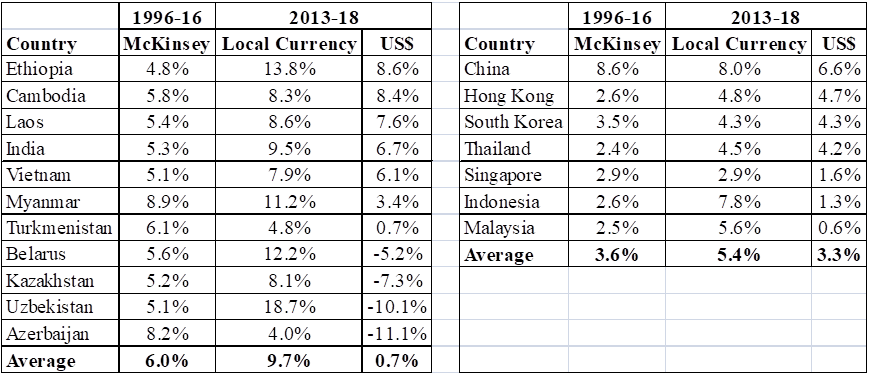
Table 1 gives several different indicators of how rapidly GDP has grown for the 18 McKinsey countries. The column on the left provides the McKinsey estimate of average annual per capita GDP growth for the 1996-16 period. In the two non-McKinsey columns, the data comes from FocusEconomics. The middle column provides per capita GDP growth in the country’s own currency. The right-hand column provides per capita GDP growth in US dollars. In short, it takes GDP growth in the local currency and adjusts it for how the currency has fared against the dollar. These dollar numbers are of greatest interest to investors wanting dollars when they sell.
It is notable that the growth in GDP reported by McKinsey is not reflected in the estimates after adjusting them for how the local currency fared against the US dollar. This is particularly true of the 11 countries whose GDP growth exceeded 5% over the last 20 years.
Table 1. – Measures of Per Capita GDP Growth (CAGR)
 Source: FocusEconomics
b. Other Indicators of Economic Well-Being
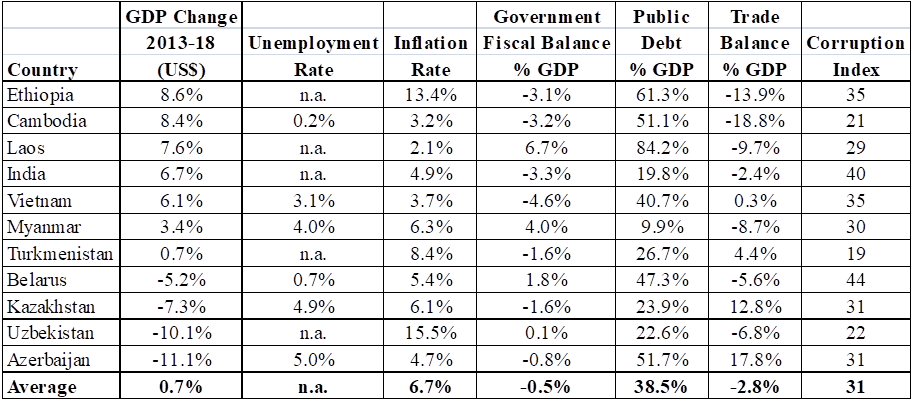
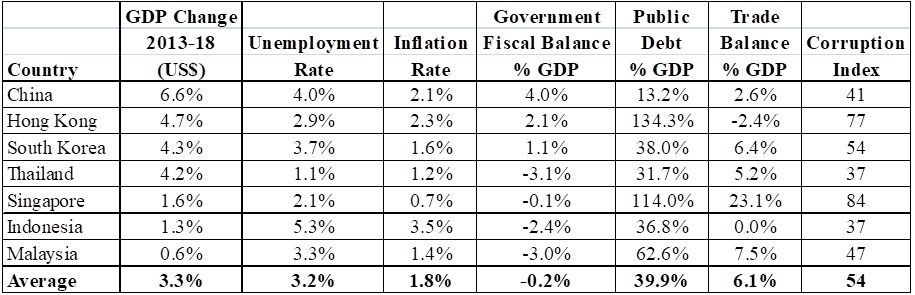
Tables 2 and 3 provide additional economic data on the 18 McKinsey countries. When comparing the two groups of countries, it is clear 11 countries did not perform well. Most notably was their poor performance on inflation, their trade balances and corruption index scores where lower numbers mean more corruption. Clearly, investments in these countries should be avoided unless you have a very strong local partner.
Table 2. – Countries w/GDP Per Capita Growth at Least 5%, Last 20 Years
 Sources: FocusEconomics and Transparency International
Table 3. – Countries w/GDP Per Capita Growth of at Least 3.5%, Last 50 Years
 Sources: FocusEconomics and Transparency International
Investment Possibilities
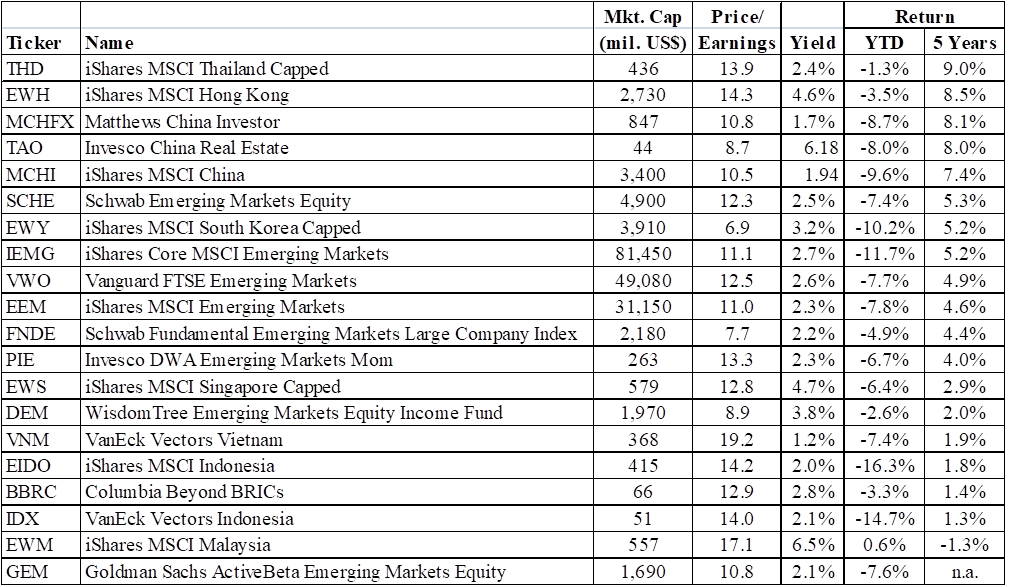
Table 4 provides a list of possible investments ranked by the five-year returns. I have included several overall emerging market possibilities and a number of country-specific funds/ETFs. All but one of the country-specific possibilities are from Table 3. Vietnam is also included because of how hard-working its people are.
I have also included three possibilities for China. They have sold off recently because of the trade war threats hanging over China. However, that makes them a potential buy: Trump knows a long trade war between China and the US is not in either country’s best interest.
Table 4. – Emerging Market Investment Possibilities
 Source: Yahoo Finance