Introduction:
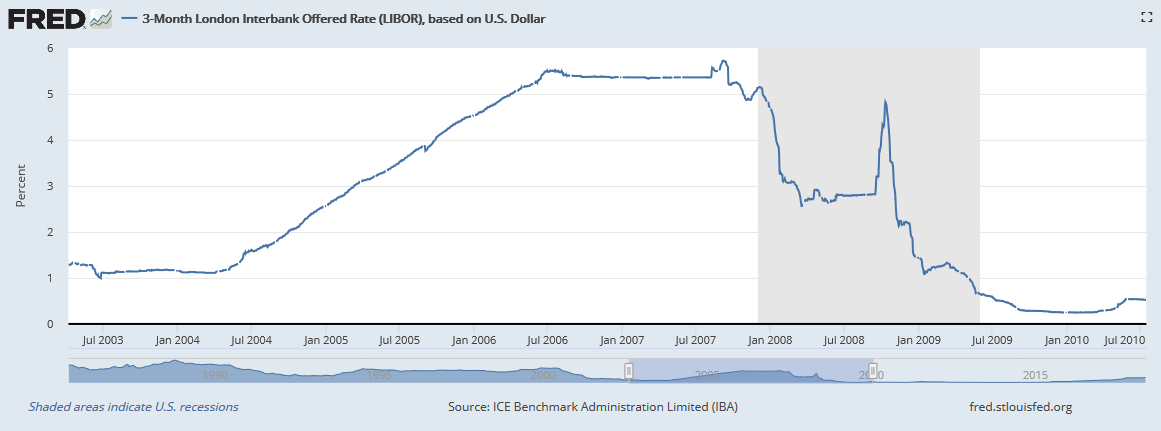
A few years before the financial crisis in 2008-2009, a group of financial companies began to issue Variable Rate Preferred securities into the market. They were popular because the economy was strong, the Federal Reserve Bank was tightening, and rates were clearly rising. These securities were also issued with minimum rates to put a floor in their distributions in case rates declined in the future. We all know the history of what happened next, but as one can see in the chart below, from '04-'06, 3-month Libor followed a pretty steady ramp upwards.
Most of these Variable Rate Preferred securities were issued with floors around 4% and are measured by the current 3-month Libor rate plus a defined number of basis points, or a spread, depending upon the given company issuing the security. Thus, the majority of these securities are still 60 basis points or greater away from floating above their minimums. However, a few of the earliest issues had lower floors of 3-3.5% and have just recently become freely floating variable securities tied to the rise in 3-month Libor rates.

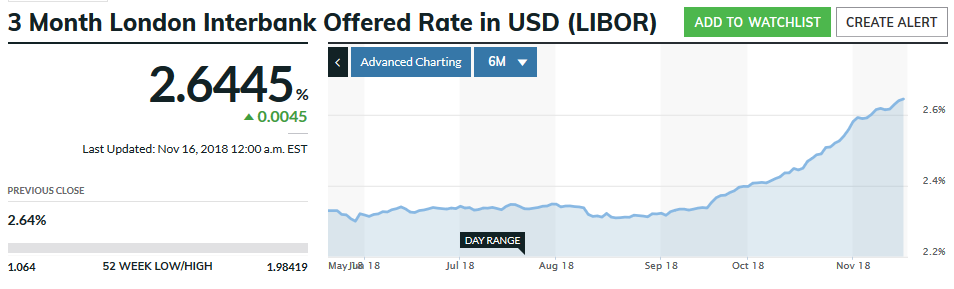
Recently, the free floating variable securities have also sold off a bit with the general decline in the Equity and Preferred securities markets. With Libor rates still rising, one might wonder if the market realizes that these securities are now free floating.
Thesis:
The simple answer is yes, these securities don't appear to be incorrectly priced given their historical trading background. In fact, the market has clearly been anticipating the impending change in these securities' distributions. Let's take a look.
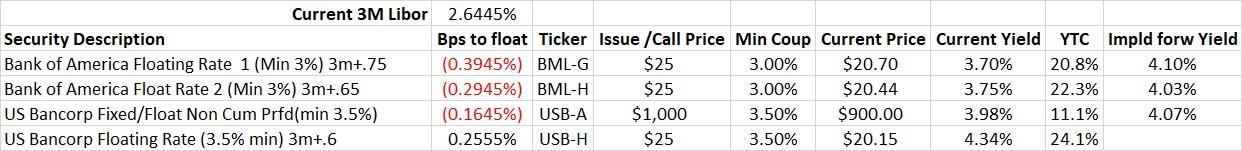
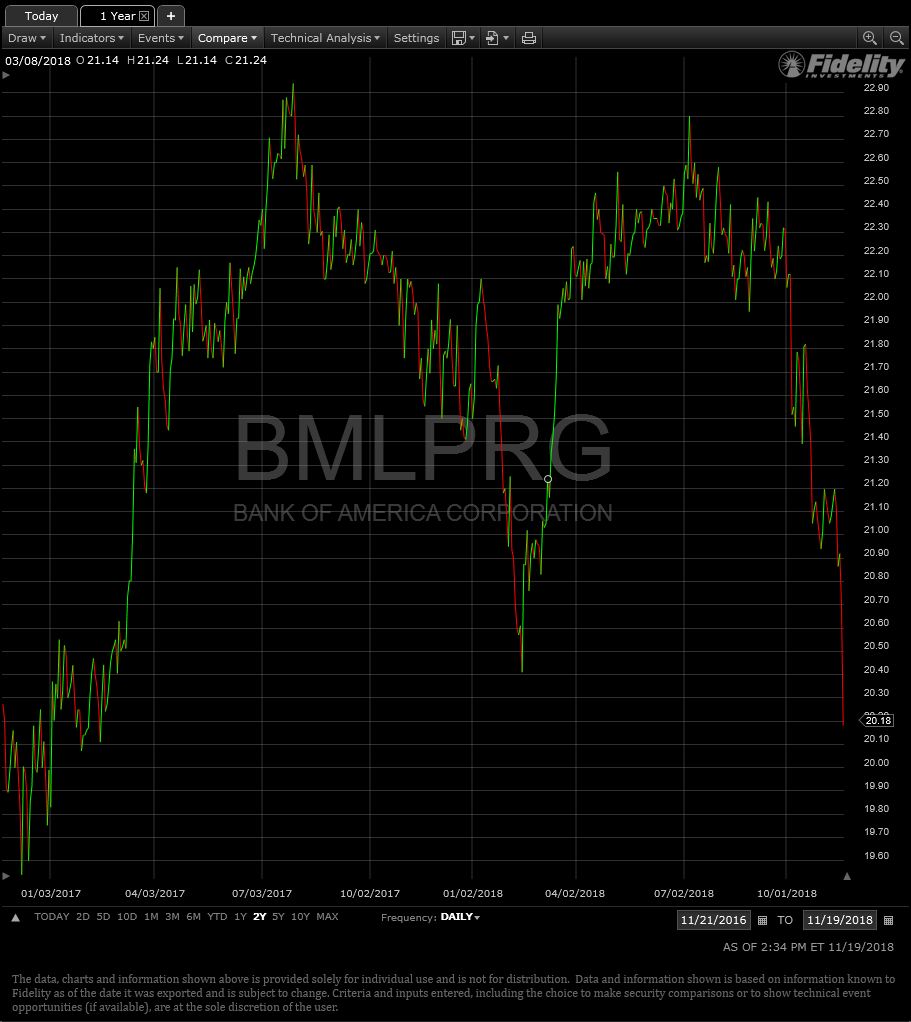
The list above is a sample of the group of these Variable Rate Preferred securities that were issued in the 2005-2007 time frame. These securities from Bank of America (BML.PG) (BML.PH) and from US Bancorp (USB.PA) are now effectively freely floating with 3-month Libor higher enough to push their rates above their minimums. USB.PH is probably only one more 25 basis point Fed hike away from joining the group. In the above chart, "Bps to float" means how many basis points away are the securities from being above their minimums. Negative figures mean that they're effectively floating free currently. The "Min Coup" column shows the minimum coupon for the security, also known as its floor rate. All of these securities are past their call dates, and they all trade below par. The last column, "Impld forw Yield," computes the current Libor rate plus the securities spread and gives what the implied go-forward yield would be, assuming Libor rates stay here into the future. It doesn't mean that that is the rate the next quarterly distribution will pay, since that is an average calculation over the entire quarter. As you will see, 4% is an important level.
3-month Libor has really started to climb since the start of October when the Equity markets began to struggle. However, that hasn't prevented these floating rate securities from also seeing weakness.
 Source: Fidelity Trader Pro, 2 Year Chart
In this case, I think the recent weakness in BML.PRG is due to the general sell-off in the Equity market that tends to also drag down the Preferred market as well. The pros and cons of the Preferred market revolve a lot around its limited liquidity. It increases the volatility of the securities, particularly in times of stress, and the reward is the higher yield one can acquire when the opportunities arise. In this case, the timing of BML.PG's recent decline was in timing with the general decline as shown in the Invesco Preferred ETF (PGX).
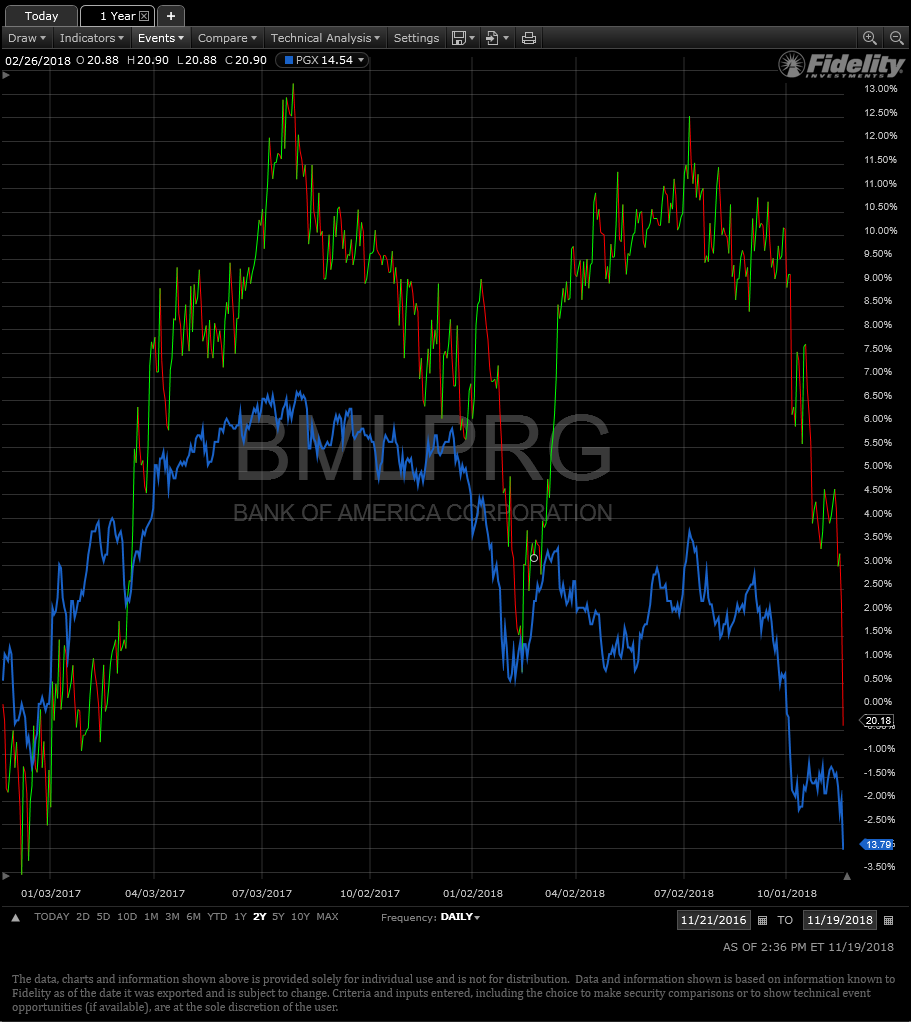 Source: Fidelity Trader Pro, 2 Year Chart (PGX Blue Line)
From a longer-term perspective, though, we can see that BML.PG has been making higher highs and lows relative to the general Preferred group. 3-month Libor started to rise in 2015 from the 25 basis points it had been stuck on since 2009. Through that time period, BML.PG traded pretty much in line with PGX. When 3-month Libor broke north of 1% in early 2017, however, BML.PG started to build a spread between itself and PGX. Effectively, it looks like the market began to discount the forward optionality of BML.PG starting to float freely.
 Source: Fidelity Trader Pro, 1/2/14-current chart (PGX Blue Line)
To give you an example of how another Variable Rate Preferred has traded over the same time frame, let's add in (BAC.PE) which is also a Bank Of America (BAC) issue, but happens to be over 1% away from floating freely above its minimum. While BAC.PE was also starting to discount the potential of floating in the future, there's a nice spread between the two securities that began in that 2017 time frame.
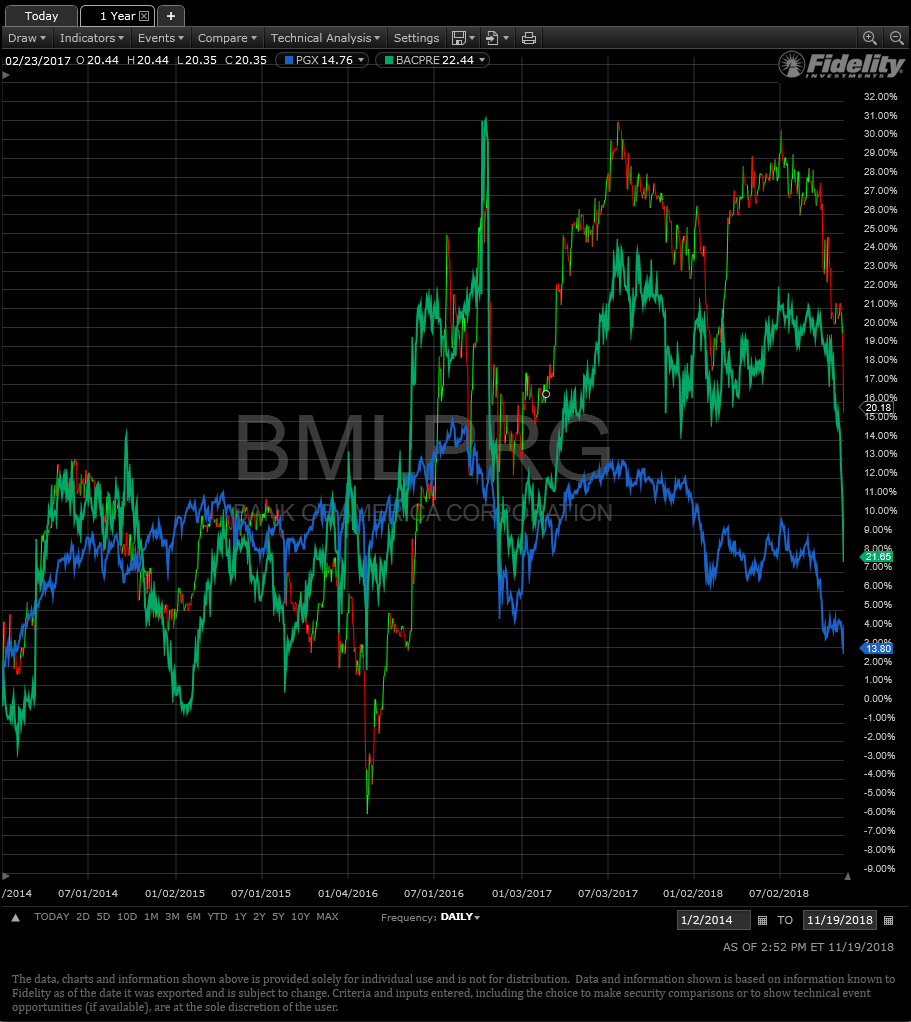 Source: Fidelity Trader Pro, 1/2/14-current chart (PGX Blue Line, BAC.PE Green Line)
The evidence suggests from the recent past, that if 3-month Libor rates continue to climb, then the securities that are now freely floating should outperform the rest of the Preferred market over time. What do the earlier periods of trading patterns suggest?
 Sources: Fidelity Trader Pro, St. Louis Fed
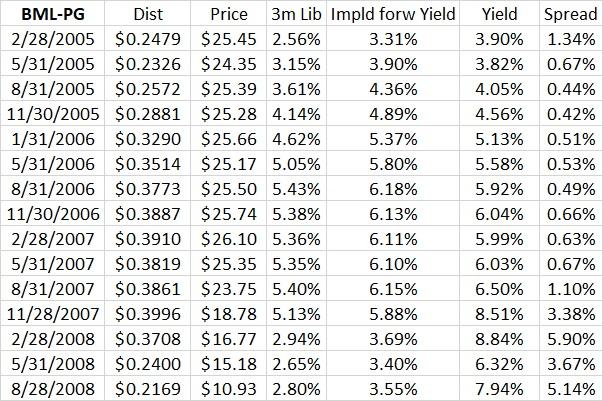
Unfortunately, I don't have a system that has this issue's historical data beyond price. Hence, I've put together this snapshot based on the distribution dates in the past. BML.PG's birth was the closest period we have to look at how it traded when 3-month Libor was at this level and rising. Two things to note for the chart above: 1.) the "Yield" is the annualized actual distribution. That first distribution in February of 2005 was higher than normal as it incorporated more than one full quarter due to the timing of its public offering. 2.) the "Spread" column is the difference between the "Yield" and "3m Lib" at that time. Thus, again that February 2005 Spread is skewed due to the oversized distribution.
A few general observations from this data. First, we really have a terribly short window to see how it traded when Libor was here around 2.5%. In general, it looks like approximately 4% yield is applicable for this level. We can't even use other securities as this one was really the first from what I can tell, and the similar securities that were issued were all done when rates were already higher. Second, even though BML.PG was years away from being callable, the price around par clearly held it from continuing to appreciate far above $25. Instead, it usually traded between $25 and $26 and distributed for a much higher yield around 6%. The 2008 period isn't that useful considering the solvency risk that BAC was considered at that point.
When I looked at other issues that began later in 2005, I found they generally yielded in the 4.55-5% range, but they also had higher floors around 4%. Their spreads were consistent with BML.PG's dancing around 50bps. Thus, while I think current pricing is in the correct zone based off of historical trading for this security, the question arises as to what would happen if rates continue to rise.
 Sources: Fidelity Trader Pro, My Estimates, St. Louis Fed
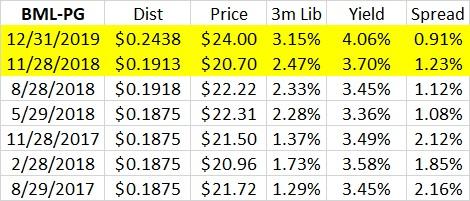
In the above chart, the yellow highlighted lines are my estimates for making a 'What-If' type of calculation. The distribution at the end of this month has been announced, but the 3-month Libor calculation is what I estimate the average works out to during this period. The top estimate is based off of what I suspect might happen if the Fed increases rates two more times, and the rate of 3-month Libor just increases by the 50 bps on top of the current approximate 2.65% it registers today. As you can see, if history is a good guide here, then around 4% yield with a 3.15% 3-month Libor could suggest BML.PG would be trading at about $24. That's about 16% higher in principal return from here. This, of course, is just an estimate to show what could happen if rates continue to rise. I might be off on the yield the market would demand, but in general, I do believe that BML.PG would have to increase in price to some degree if Libor were to reach a 3.15% type of level.
Conclusion:
The ability to produce significant principal return if rates continue to rise is an attractive addition to a Preferred security portfolio. I worry that some investors think they're protected by owning Fixed-to-Float hybrid securities. However, the vast majority of those securities are fixed right now and will trade as such until they get closer to their call dates. In fact, the floating conversion feature is really just an incentive to force the issuer to call in the security if rates continue to rise. I like the feature, but it doesn't start having an impact until you get close enough to the call date for the market to begin to discount the possibility. To have current protection, you need to have securities that are actually floating right now. These older Variable Rate securities that have already crossed above their minimums could be useful in this regard. I've taken exposure in the BML.PG, and the USB.PH. The latter of which is close to free floating after one more raise, and I find U.S. Bancorp (USB) to be a superior credit risk.
In general, I'm not as concerned about the credit risk of the banks at issue relative to the 2008-2009 period, as they all have materially reduced their degree of leverage from that point in time. A few extra things to note is that these issues are generally not cumulative. The only one that I follow that is cumulative was issued by SunTrust Banks Inc. (STI) (STI.PA), but it still is over 80 bps away from free floating. However, these securities were all issued by financial institutions. Therefore, they all do qualify for the lower tax rate of 15-20% depending on the investor.
The floating rate alternatives to taking the company specific risks that these Variable Preferred securities impose, can be accessed through ETFs such as iShares Floating Rate Bond (BATS:FLOT), and the SPDR Blmbrg Barclays Inv Grd Floating Rate Bond ETF (NYSEARCA:FLRN). Both of these will pay around current 3-month Libor rate and maintain a fairly stable price over time. I have exposure to both, but I've started to use the securities under discussion to augment my floating rate exposure. The combination of gaining 125-140 basis points of yield on top of the ETF options, plus the potential of principal appreciation if rates continue to rise, is compelling enough for me to warrant the individual credit exposure and volatility.
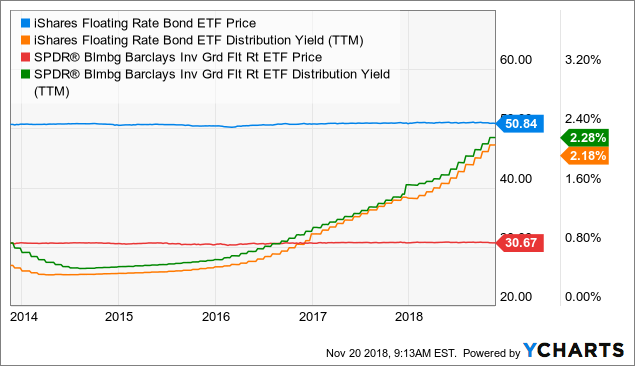 FLOT data by YCharts
I'm seeing some signs in the market that suggest the shorter duration portion of the yield curve may have peaked in rates. However, I also believe that the Federal Reserve is going to continue to raise their rate until something breaks. They're likely doing this to give themselves as much room as possible to respond in the future. If this is the case, then the 3-month Libor rate would likely continue to rise with the Fed Funds rate, even if the U.S. Treasury 5-year rate, for example, were to actually start declining on future growth concerns. These free floating variable securities could be a good way to offset principal loss from your other fixed Preferred securities, if I'm wrong and the long end of the curve continues to rise. With the recent liquidity-driven decline in these securities, now might be an opportune time to diversify into a security that will increase in both distribution and likely principal as well, if the surge in interest rates refuses to subside.
For more articles like these, you can follow me here on Seeking Alpha. Good luck investing to everyone out there.