The political standoff in Washington appeared to grow as Nancy Pelosi suggested the President cancel the state of the union address while President Trump grounded a military flight for the Democratic Congressional delegation to Afghanistan. On Saturday, the White House offered an apparent compromise to Congress to resolve the ongoing record-long government shutdown. However, it was swiftly rejected by the Democrats.
Reports out this past week suggested that some Treasury officials are pushing for an easing of trade sanctions with China - the country has generated some goodwill on the part of the US administration by increasing its soybean purchases. Markets continued to rally, supported by a recovery in risk sentiment, hopes for easing of trade relations, and more Fed officials promising to use caution in navigating current markets.
We continue to like tactical allocations at the margin in the closed-end fund space while the period of heightened volatility and wide discounts remains. Sectors that screen well on our favored yield percentile vs. discount Z-score metric are Convertibles, Real Estate and Loans among others.

Source: ADS Analytics LLC, Bloomberg
Macro
Fed fund futures have recovered this year, rising by one additional hike from the lows of end of 2018. Dallas Fed President Robert Kaplan joined Chairman Powell recently in urging caution in the rate hiking path.

Source: ADS Analytics LLC, Bloomberg
Industrial production rose 0.3% in December partly due to a sharp boost in autos. The Empire and Philly Fed surveys for January were more mixed with the reports pointing to a slowdown in factory activity.
Markets
Markets extended their winning streak with guarded optimism about Chinese economic activity and trade talks boosting risk assets. Commodities were in the forefront, spurred on by trade optimism and a stabilization of activity in the US. The same dynamic pushed high-beta emerging market assets higher as well. US fixed-income performance was more muted, given the divergence between the moves in interest rates and credit spreads. Mortgage asset performance was slightly negative, and treasuries closed out the asset returns spectrum along with gold.

Source: ADS Analytics LLC, Bloomberg
Fund Space
Closed-end funds had a good week with nearly all sectors registering positive NAV returns with discount performance split about 50:50. Higher-beta sectors outperformed, with MLP leading the way followed by equity-linked sectors. Fixed-income lagged as higher interest rates weighed on performance.

Source: ADS Analytics LLC, Bloomberg
CEFs for the Long-Term?
Recently, a retiree posted a question on one of the CEF message boards whether it made sense to invest in closed-end funds for the long-term. There were many answers, mostly warning the poster about discount dynamics and the right entry-points. One poster, however, had an unequivocal answer - No.
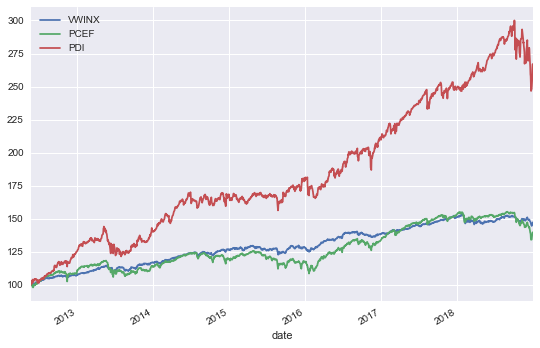
To back up his answer, he drew attention to the comparison between two funds: the Vanguard Wellesley Income Fund (VWINX) and the Invesco CEF Income Composite ETF (PCEF). The former fund is meant to represent a benchmark balanced-income fund composed of large-cap dividend stocks, investment-grade and government bonds, while the latter represents a proxy for the CEF market.
As the chart below suggests, VWINX clearly outperforms PCEF (by about 1.4% per year), with half the volatility and smaller drawdowns. Case closed?

Source: ADS Analytics LLC, Bloomberg
We think not - for the simple reason that we think the comparison elides many important details which we thought it would be interesting to review.
So, what are the issues with the above comparison?
- Our first issue is with the fees - the total amount of fees for PCEF and its underlying funds is over 2% vs. 0.22% for VWINX or nearly 1.8% per year.
- Another key difference has to do with equity exposures where PCEF accesses equity exposure through covered calls while VWINX holds direct stocks. As we have covered before, covered calls have underperformed their underlying portfolios since the financial crisis due to volatility remaining relatively muted and stock returns being fairly high.
- Distribution rates are very different between the two funds by roughly 4%. This 4% is not assumed to be reinvested in the total return chart above. This adds another 0.30% a year in favor of PCEF.
- There is a different amount of leverage in the two funds with PCEF underlying funds employing 20-30% leverage whereas VWINX is not leveraged.
- PCEF strategy is to overweight funds with wider discounts. It's not obvious that this strategy will generate alpha as it is often funds that destroy value and have high fees that have wider discounts.
- CEF discounts are currently relatively wide which depresses the performance of PCEF.
- Outside of equities, there is a difference in asset holdings with PCEF not holding many government bonds and PCEF holding more preferreds and non-investment grade credit.
We are not apologists for PCEF - in the end, we don't think this is a great fund to hold. However, we need to be careful using this comparison when making conclusions about the overall CEF universe. The chart below is a good reminder that closed-end funds can offer superior performance.
Source: ADS Analytics LLC, Bloomberg
So, if the comparison above is not the right one to make - how should we think about the CEF space? A much better comparison we think is to compare CEF sectors to ETF benchmarks of the same sector.
To pick just three of the sectors that we have written about - we compare total returns of the CEF sector to the benchmark ETF investing in the same sector.

Source: ADS Analytics LLC, Bloomberg

Source: ADS Analytics LLC, Bloomberg

Source: ADS Analytics LLC, Bloomberg
What is driving the outperformance of closed-end funds over ETFs?
We think the key drivers are the following:
- As income products, CEFs tend to have higher leverage and tend to hold higher-yielding assets
- The lack of underlying asset liquidity guarantee allows CEFs to invest in securities that may offer an illiquidity premium - the Mortgage RMBS sector is a good example of this.
- CEF active mandates, particularly in fixed-income sectors make it easier to outperform their passive ETF peers.
Conclusion
We are fairly agnostic about assets wrappers - whether open-end or closed-end. Each one has its advantages and disadvantages, and neither is always best. While closed-end funds have been beaten up this year, we think the structure has a lot to offer investors. The details matter, however. The first step is in understanding which sectors can benefit from being held in a closed-end wrapper and why. The second step is to understand which management teams are more likely to deliver alpha and what tactical rules are best to employ within the space. This is precisely where our focus is and what our approach to the space has been for the last year. Thanks for reading.
Disclaimer: This article is for information purposes only and does not constitute investment advice or an offer or the solicitation of an offer to buy or sell any securities. Past performance is not a guarantee and may not be repeated. Investment strategies are not suitable for everyone and you should always conduct your own research or speak to a financial advisor. Although information in this document has been obtained from sources believed to be reliable, ADS ANALYTICS LLC does not guarantee its accuracy or completeness and accept no liability for any direct or consequential losses arising from its use. ADS ANALYTICS LLC does not provide tax or legal advice. Any such taxpayer should seek advice based on the taxpayer’s particular circumstances from an independent tax advisor.