
1. Technical parameters
In the last six years, the dynamics of Facebook (FB) stock price is qualitatively (R2=0.9) described by the exponential trend that acts as a smart average and looks like a straight line on the graphs with log y-axis:
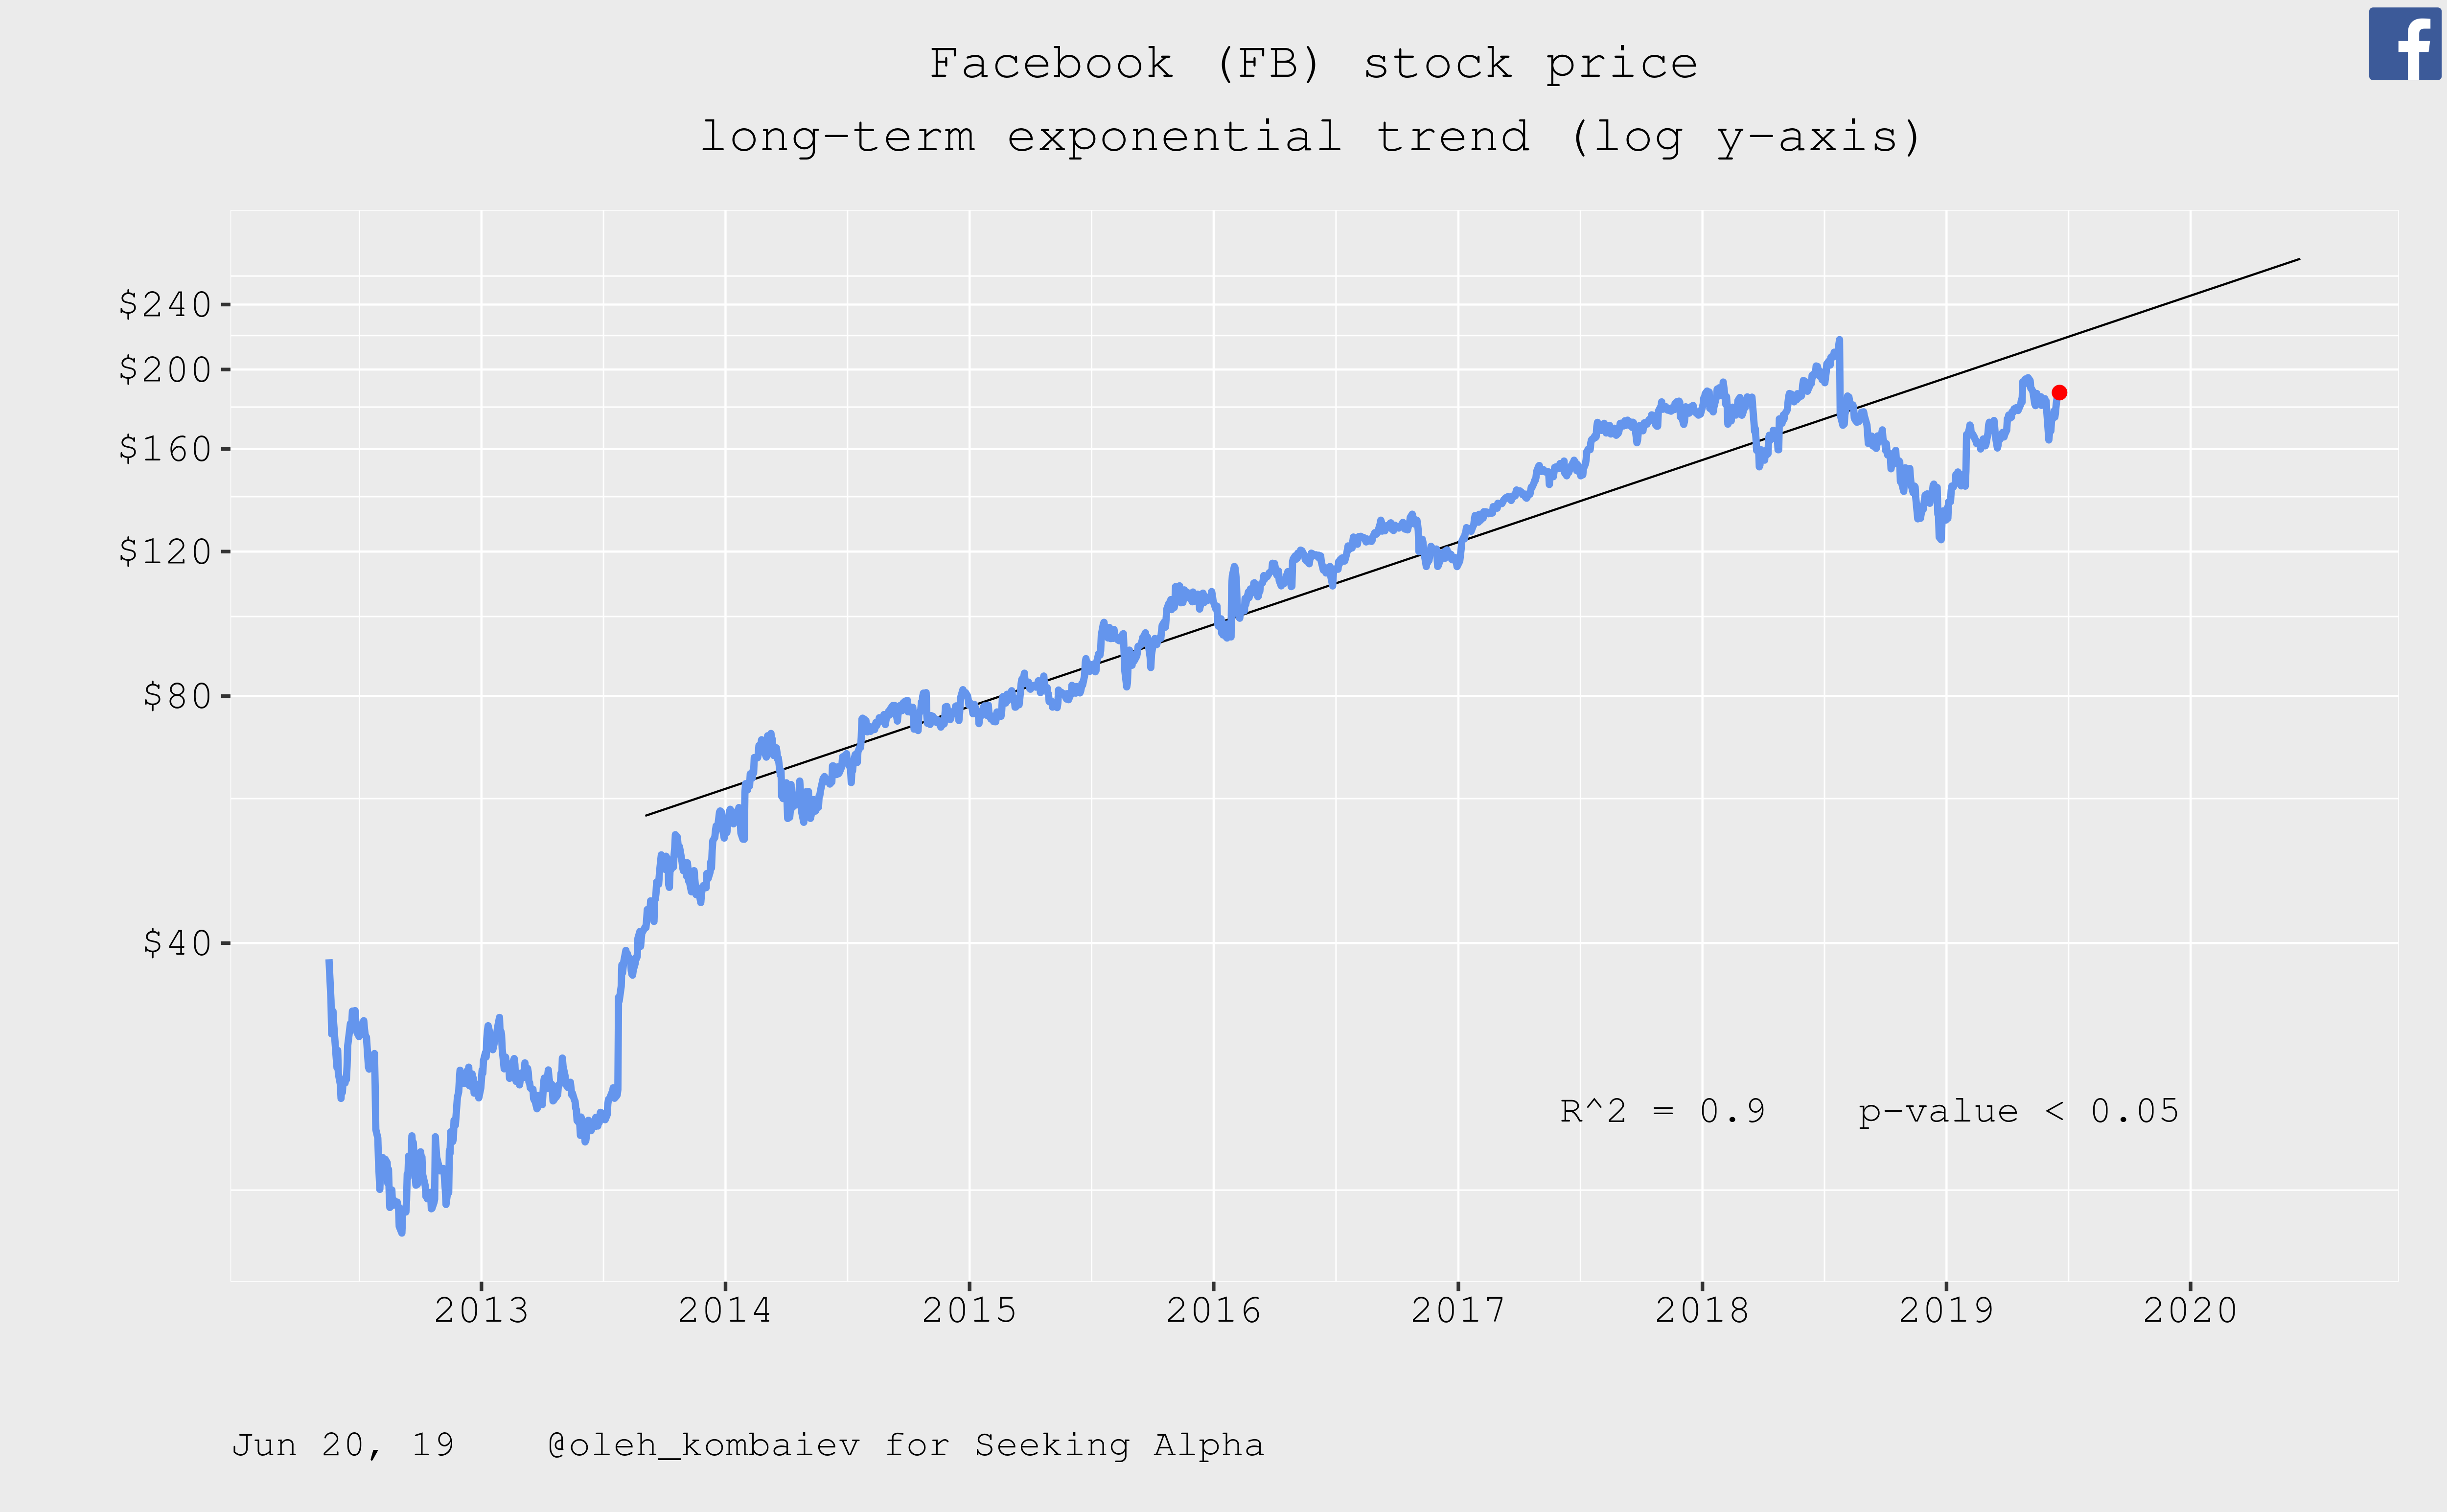
At the moment, the company's stock price is below this trend by more than one standard deviation:
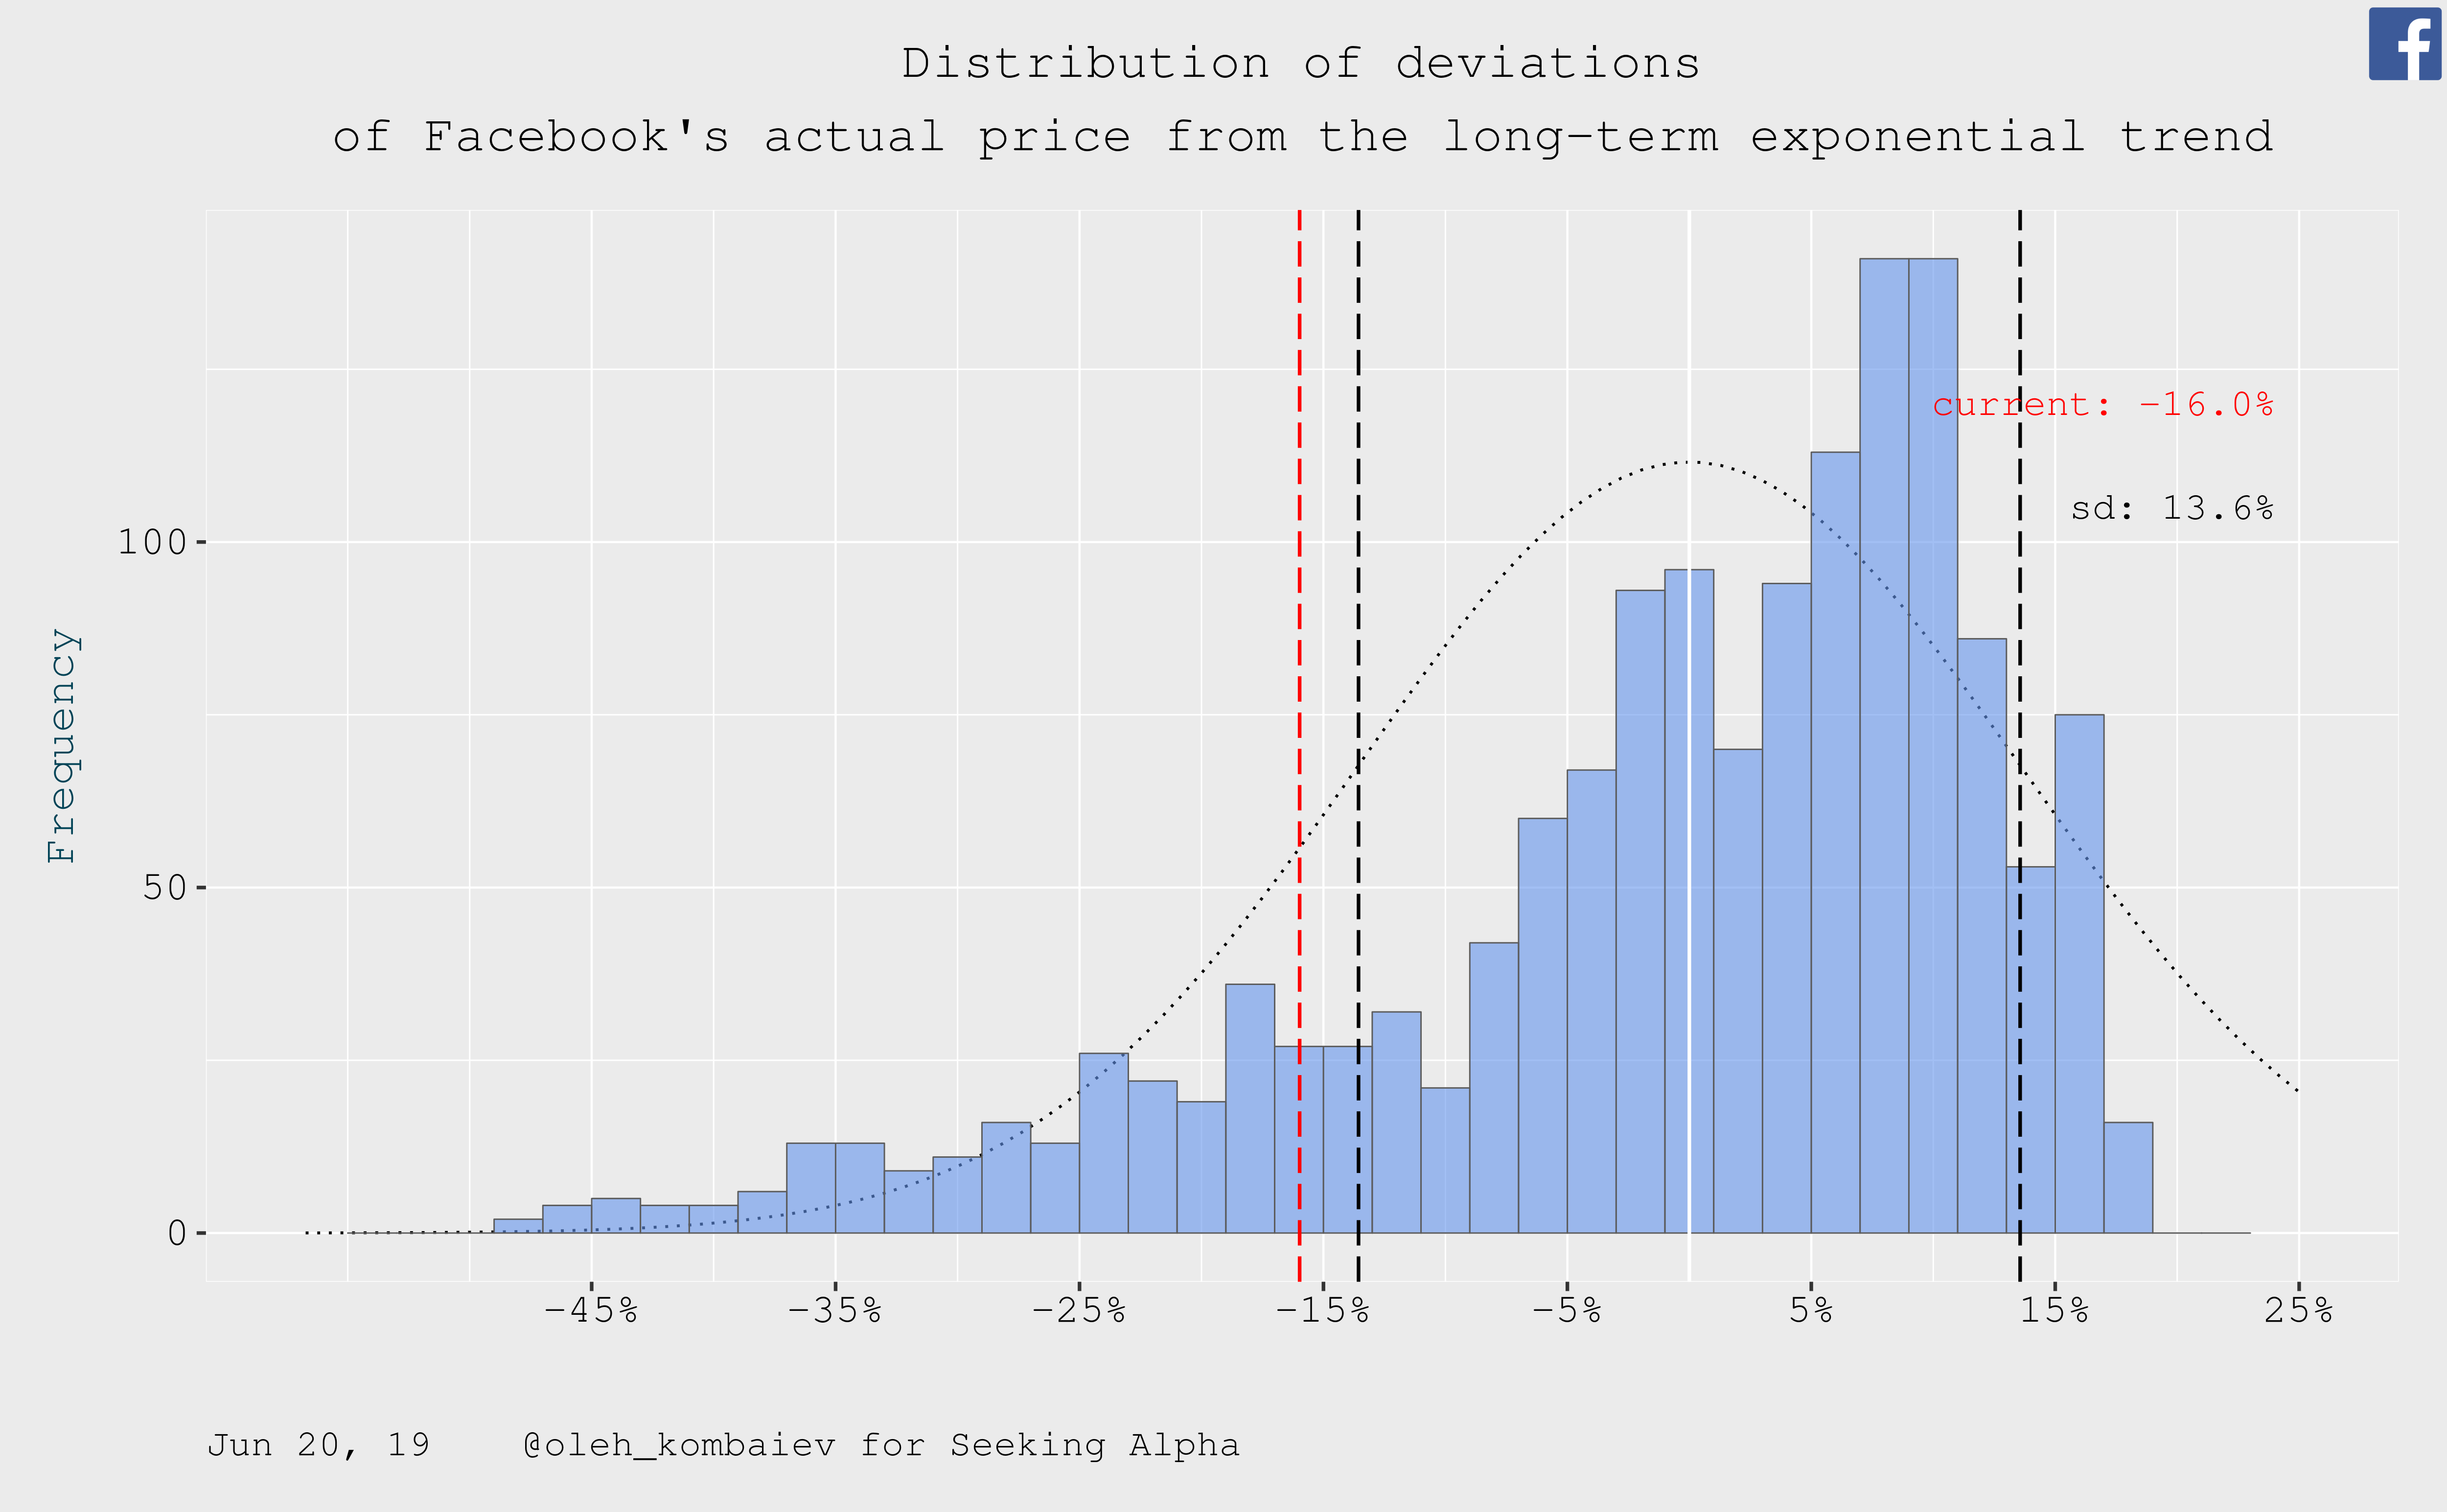
This situation has been observed for over a year. But at the same time, there is a gradual synchronization of the dynamics of Facebook stock price and its exponential trend:
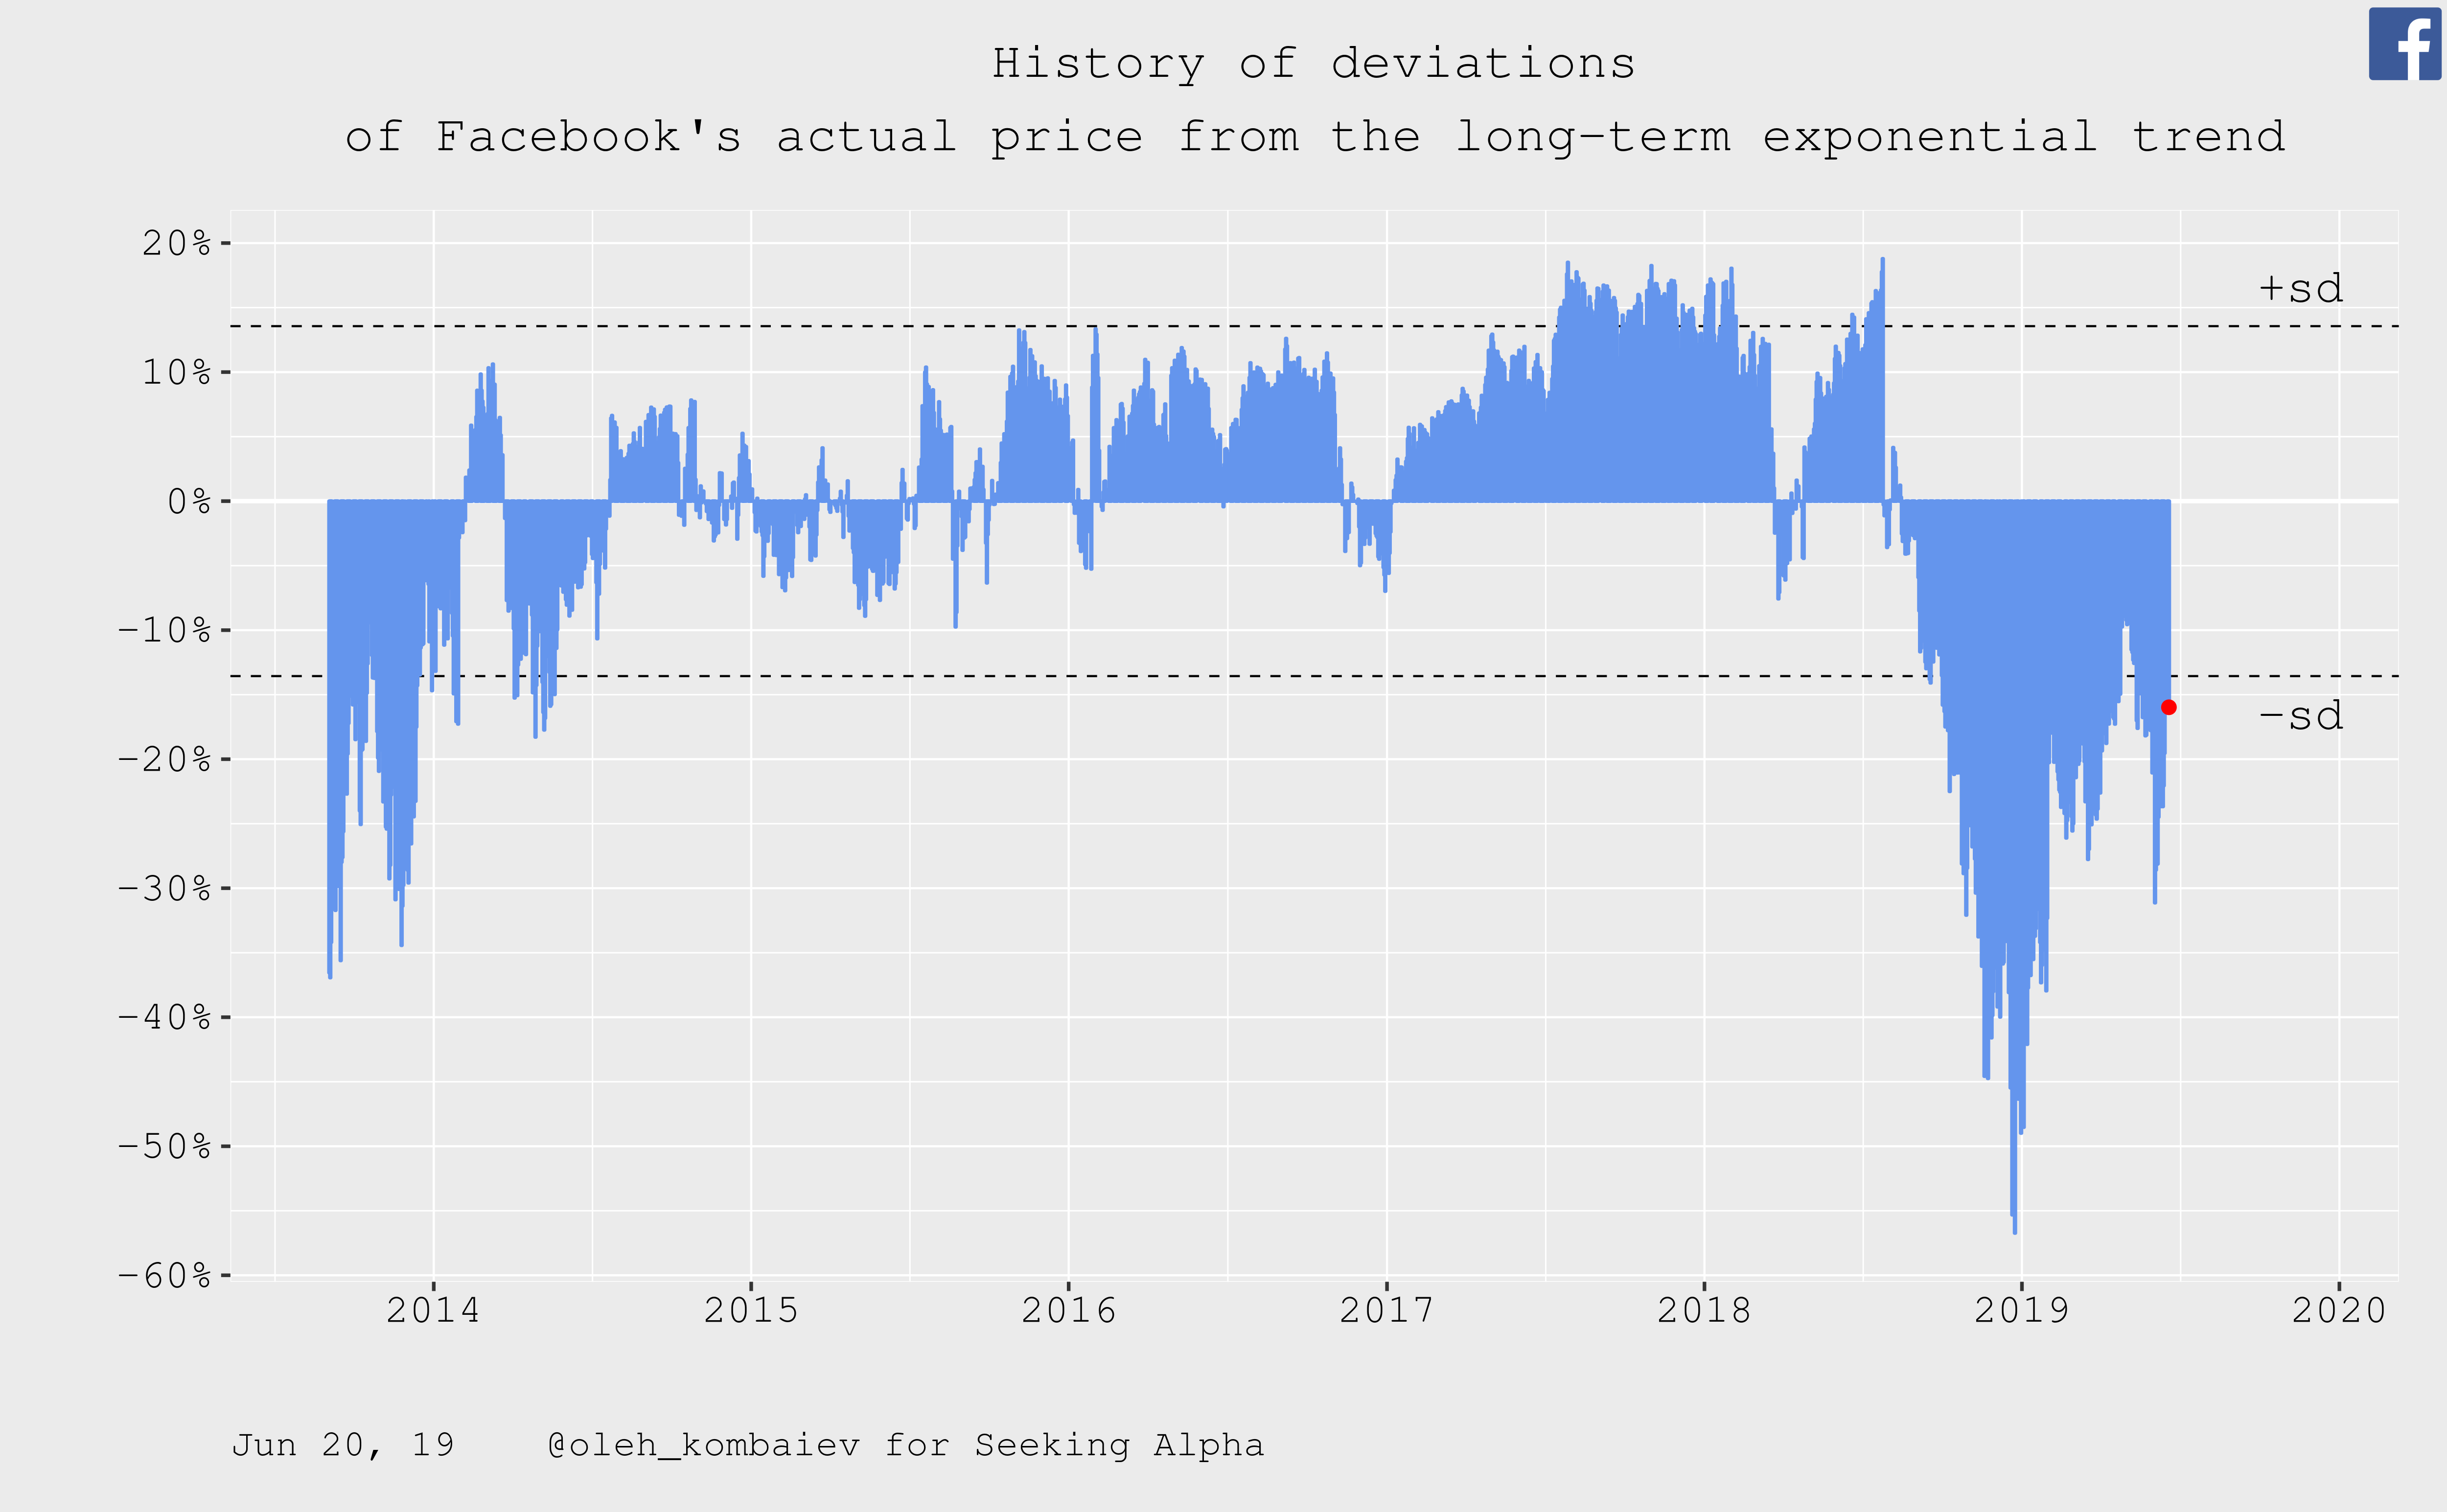
Throughout the year, the rolling annual total price return of Facebook's stock has been fluctuating around the lower border of the standard deviation. It's typical when reaching the bottom:
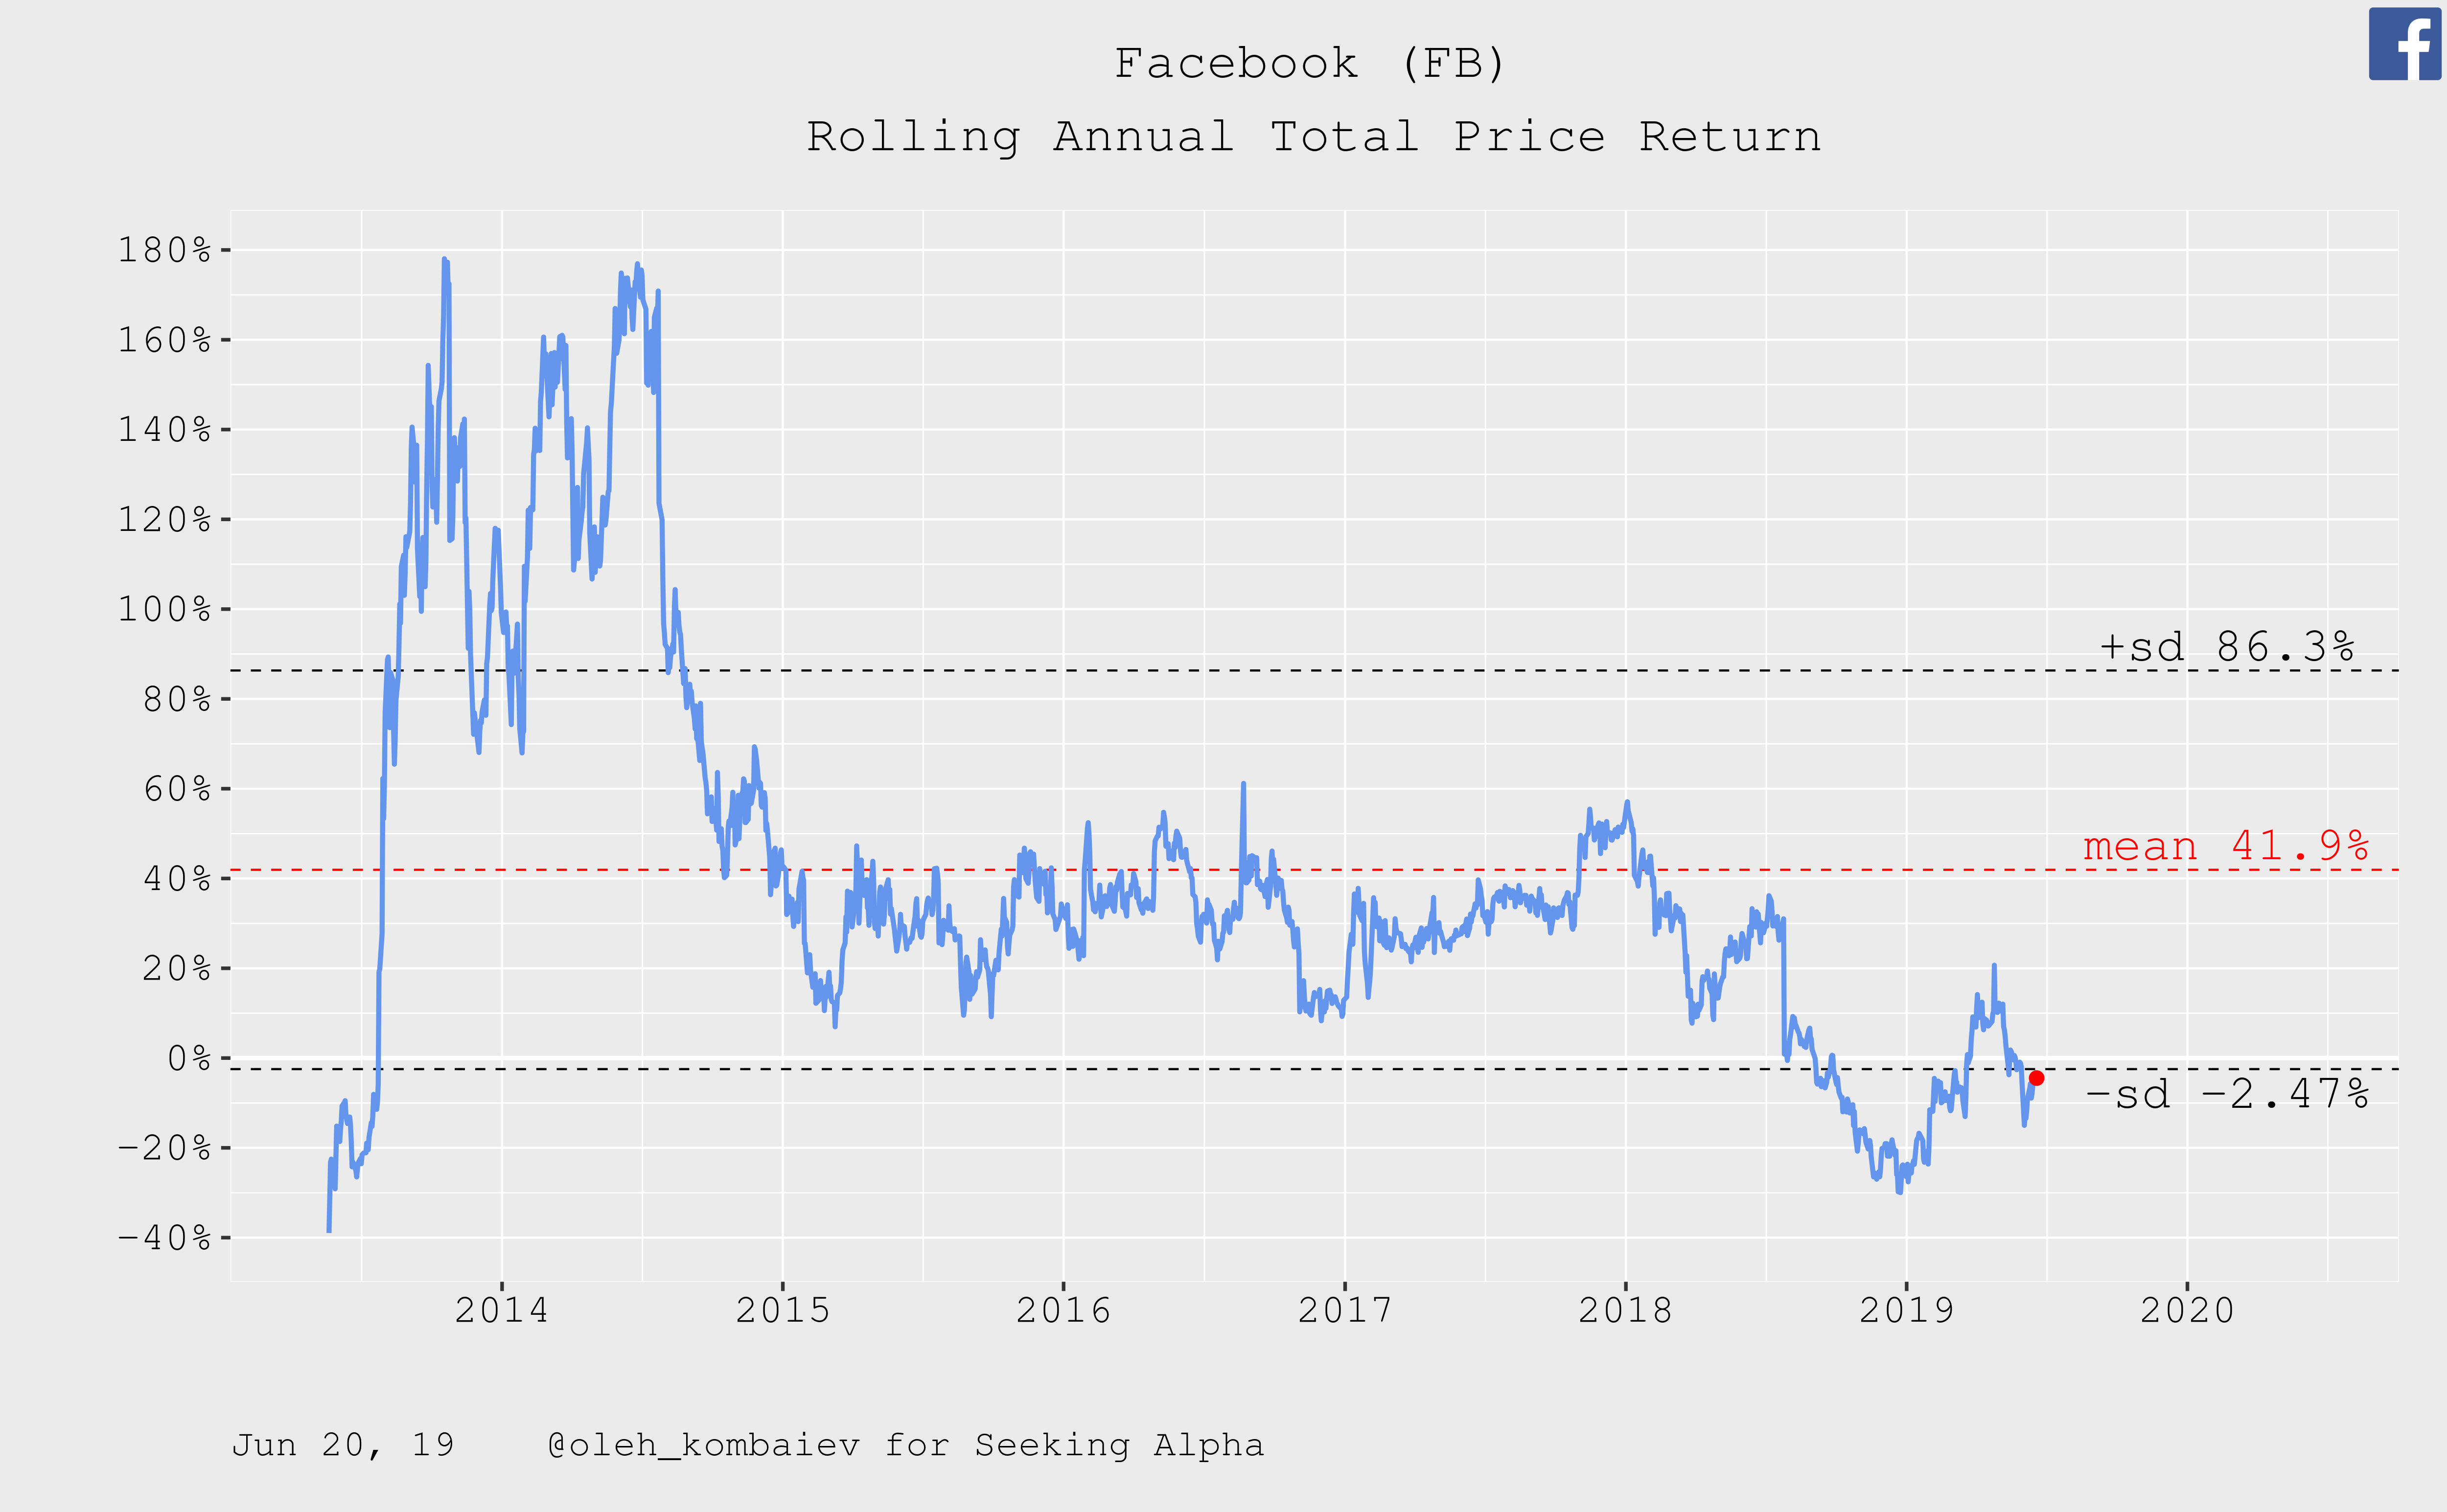
So, technically, now Facebook's stock price looks balanced and ready for growth.
2. Growth drivers
Let's start with revenue.
The long-term relationship between the revenue TTM absolute size and Facebook's capitalization describes the company's current capitalization as almost perfectly balanced:
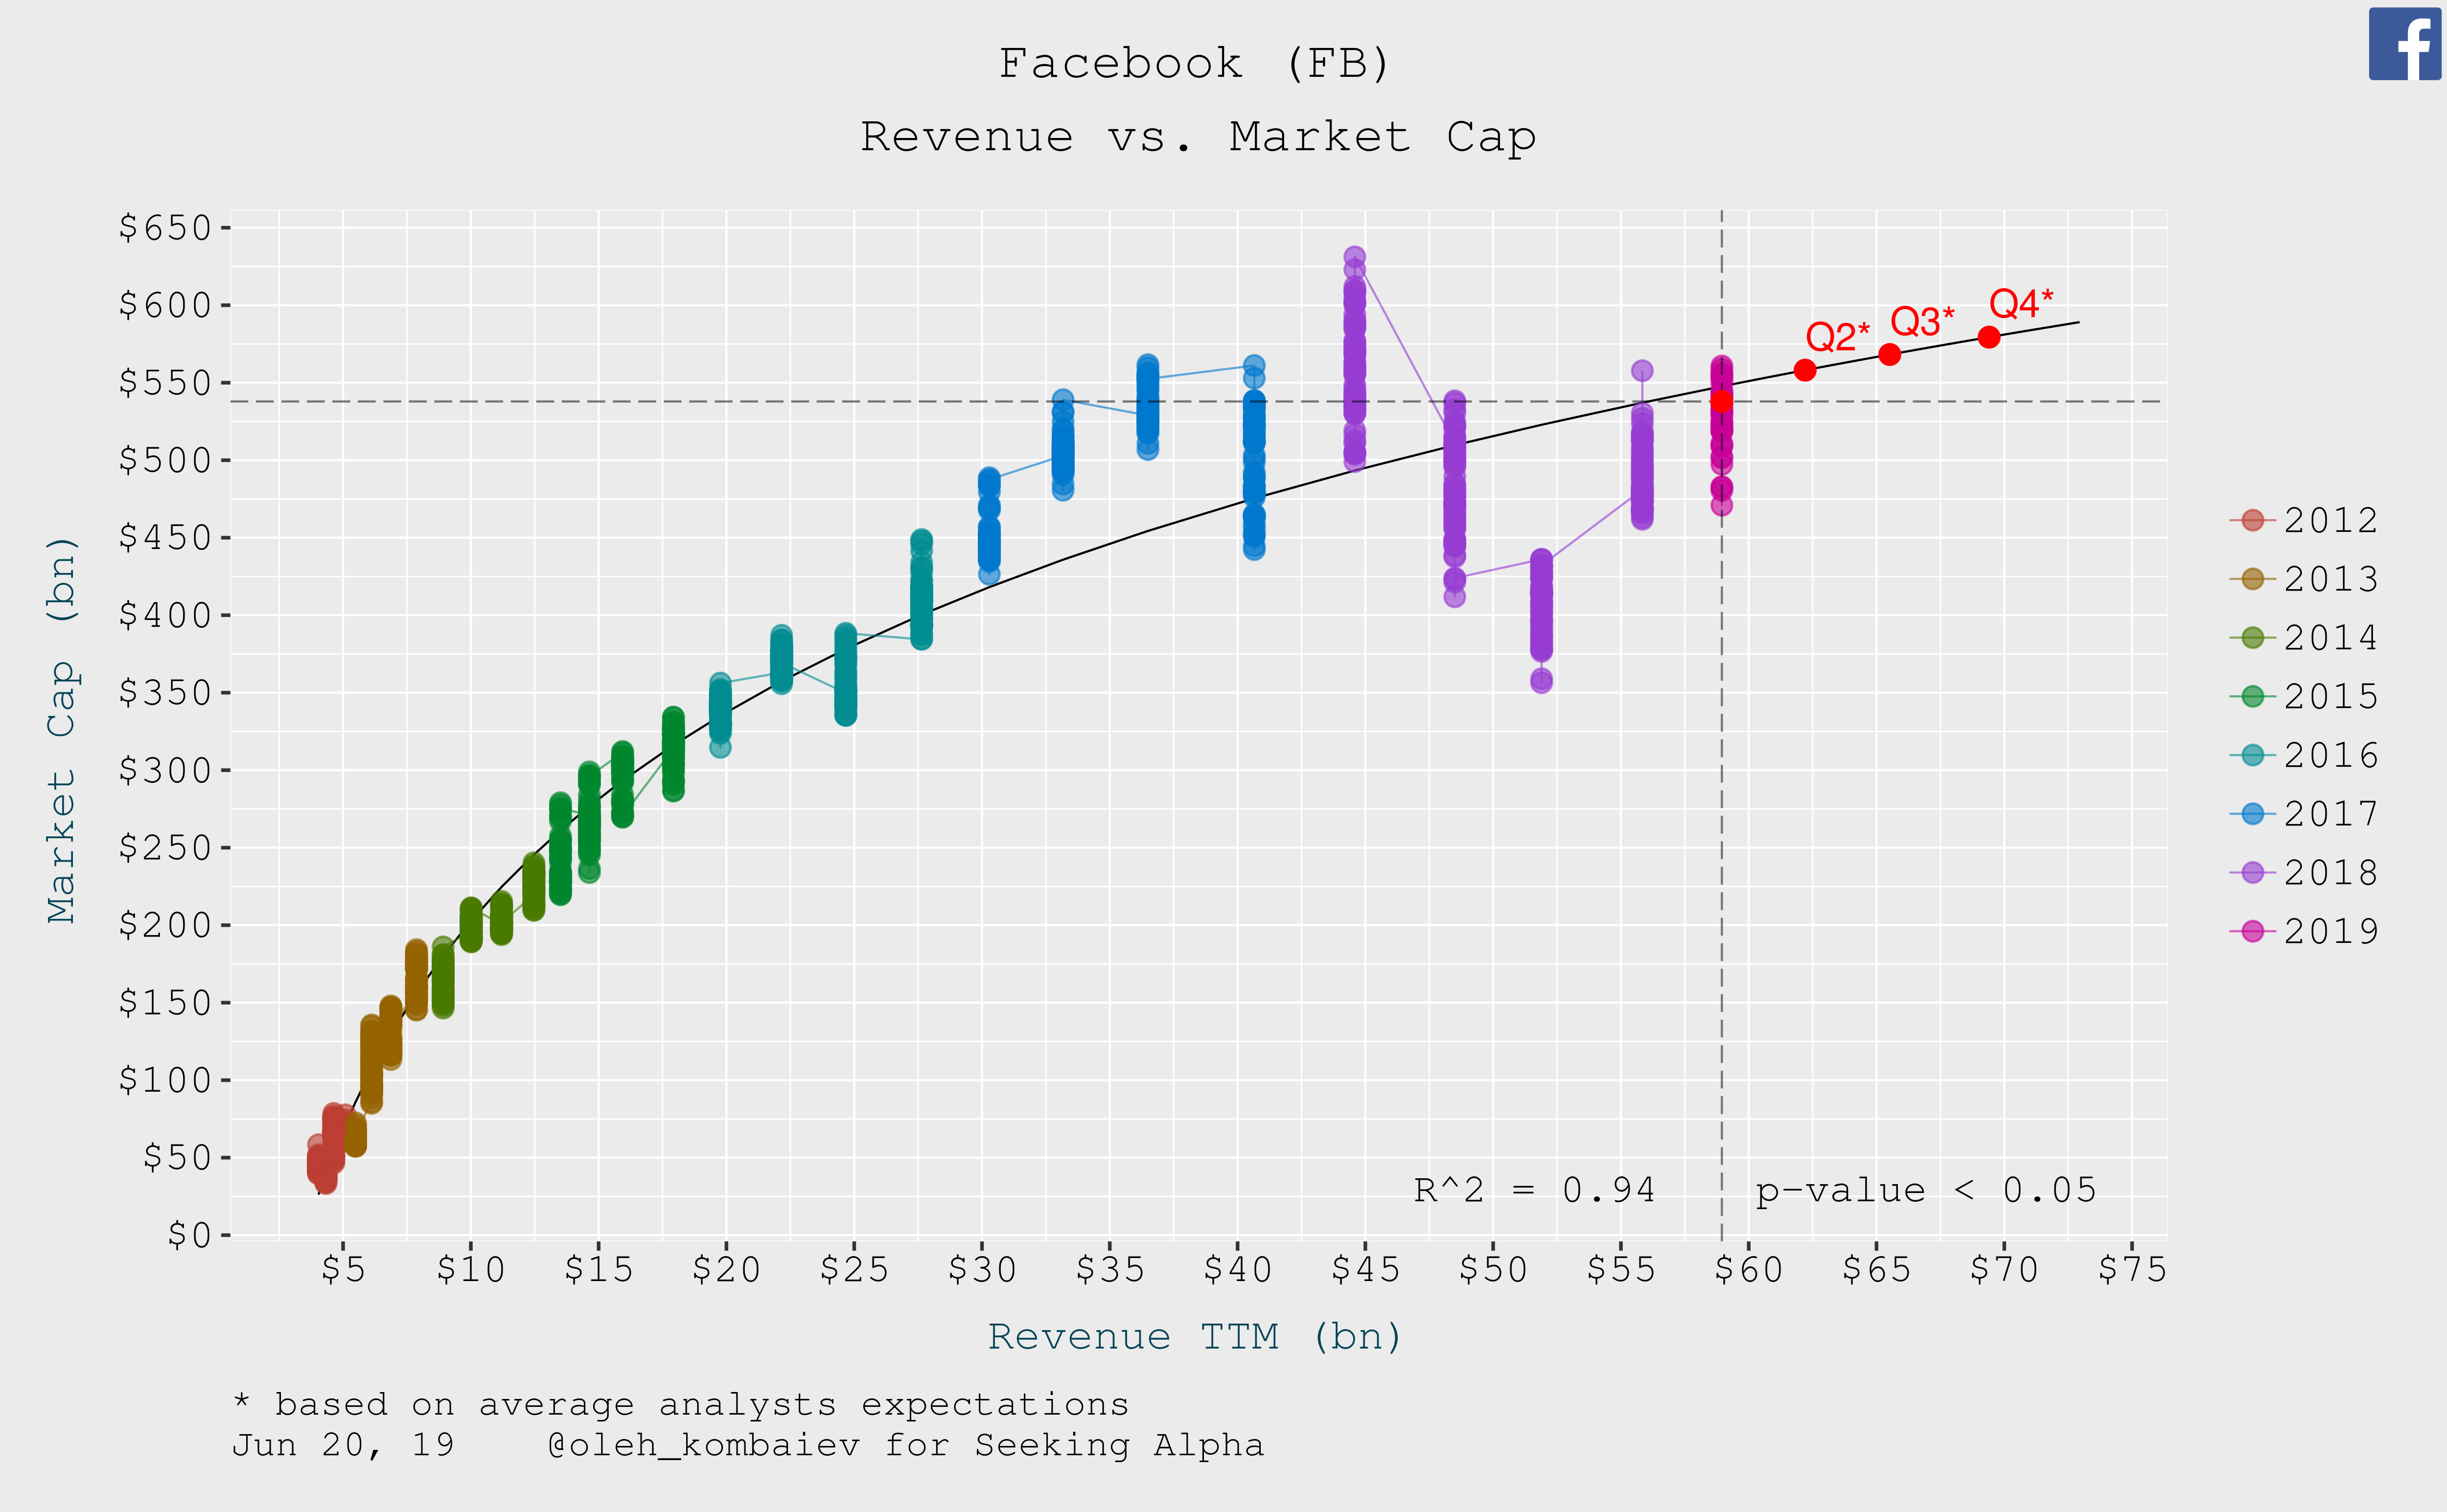
But it should be noted that this relationship is not linear, but logarithmic. It means that each year Facebook's revenue growth is accompanied by slowing growth in capitalization. And if analysts' average expectations concerning the revenue of Facebook in Q4 2019 come true, the company's balanced capitalization will approach $575 trln within the bounds of the proposed models. Not much more than the current level...
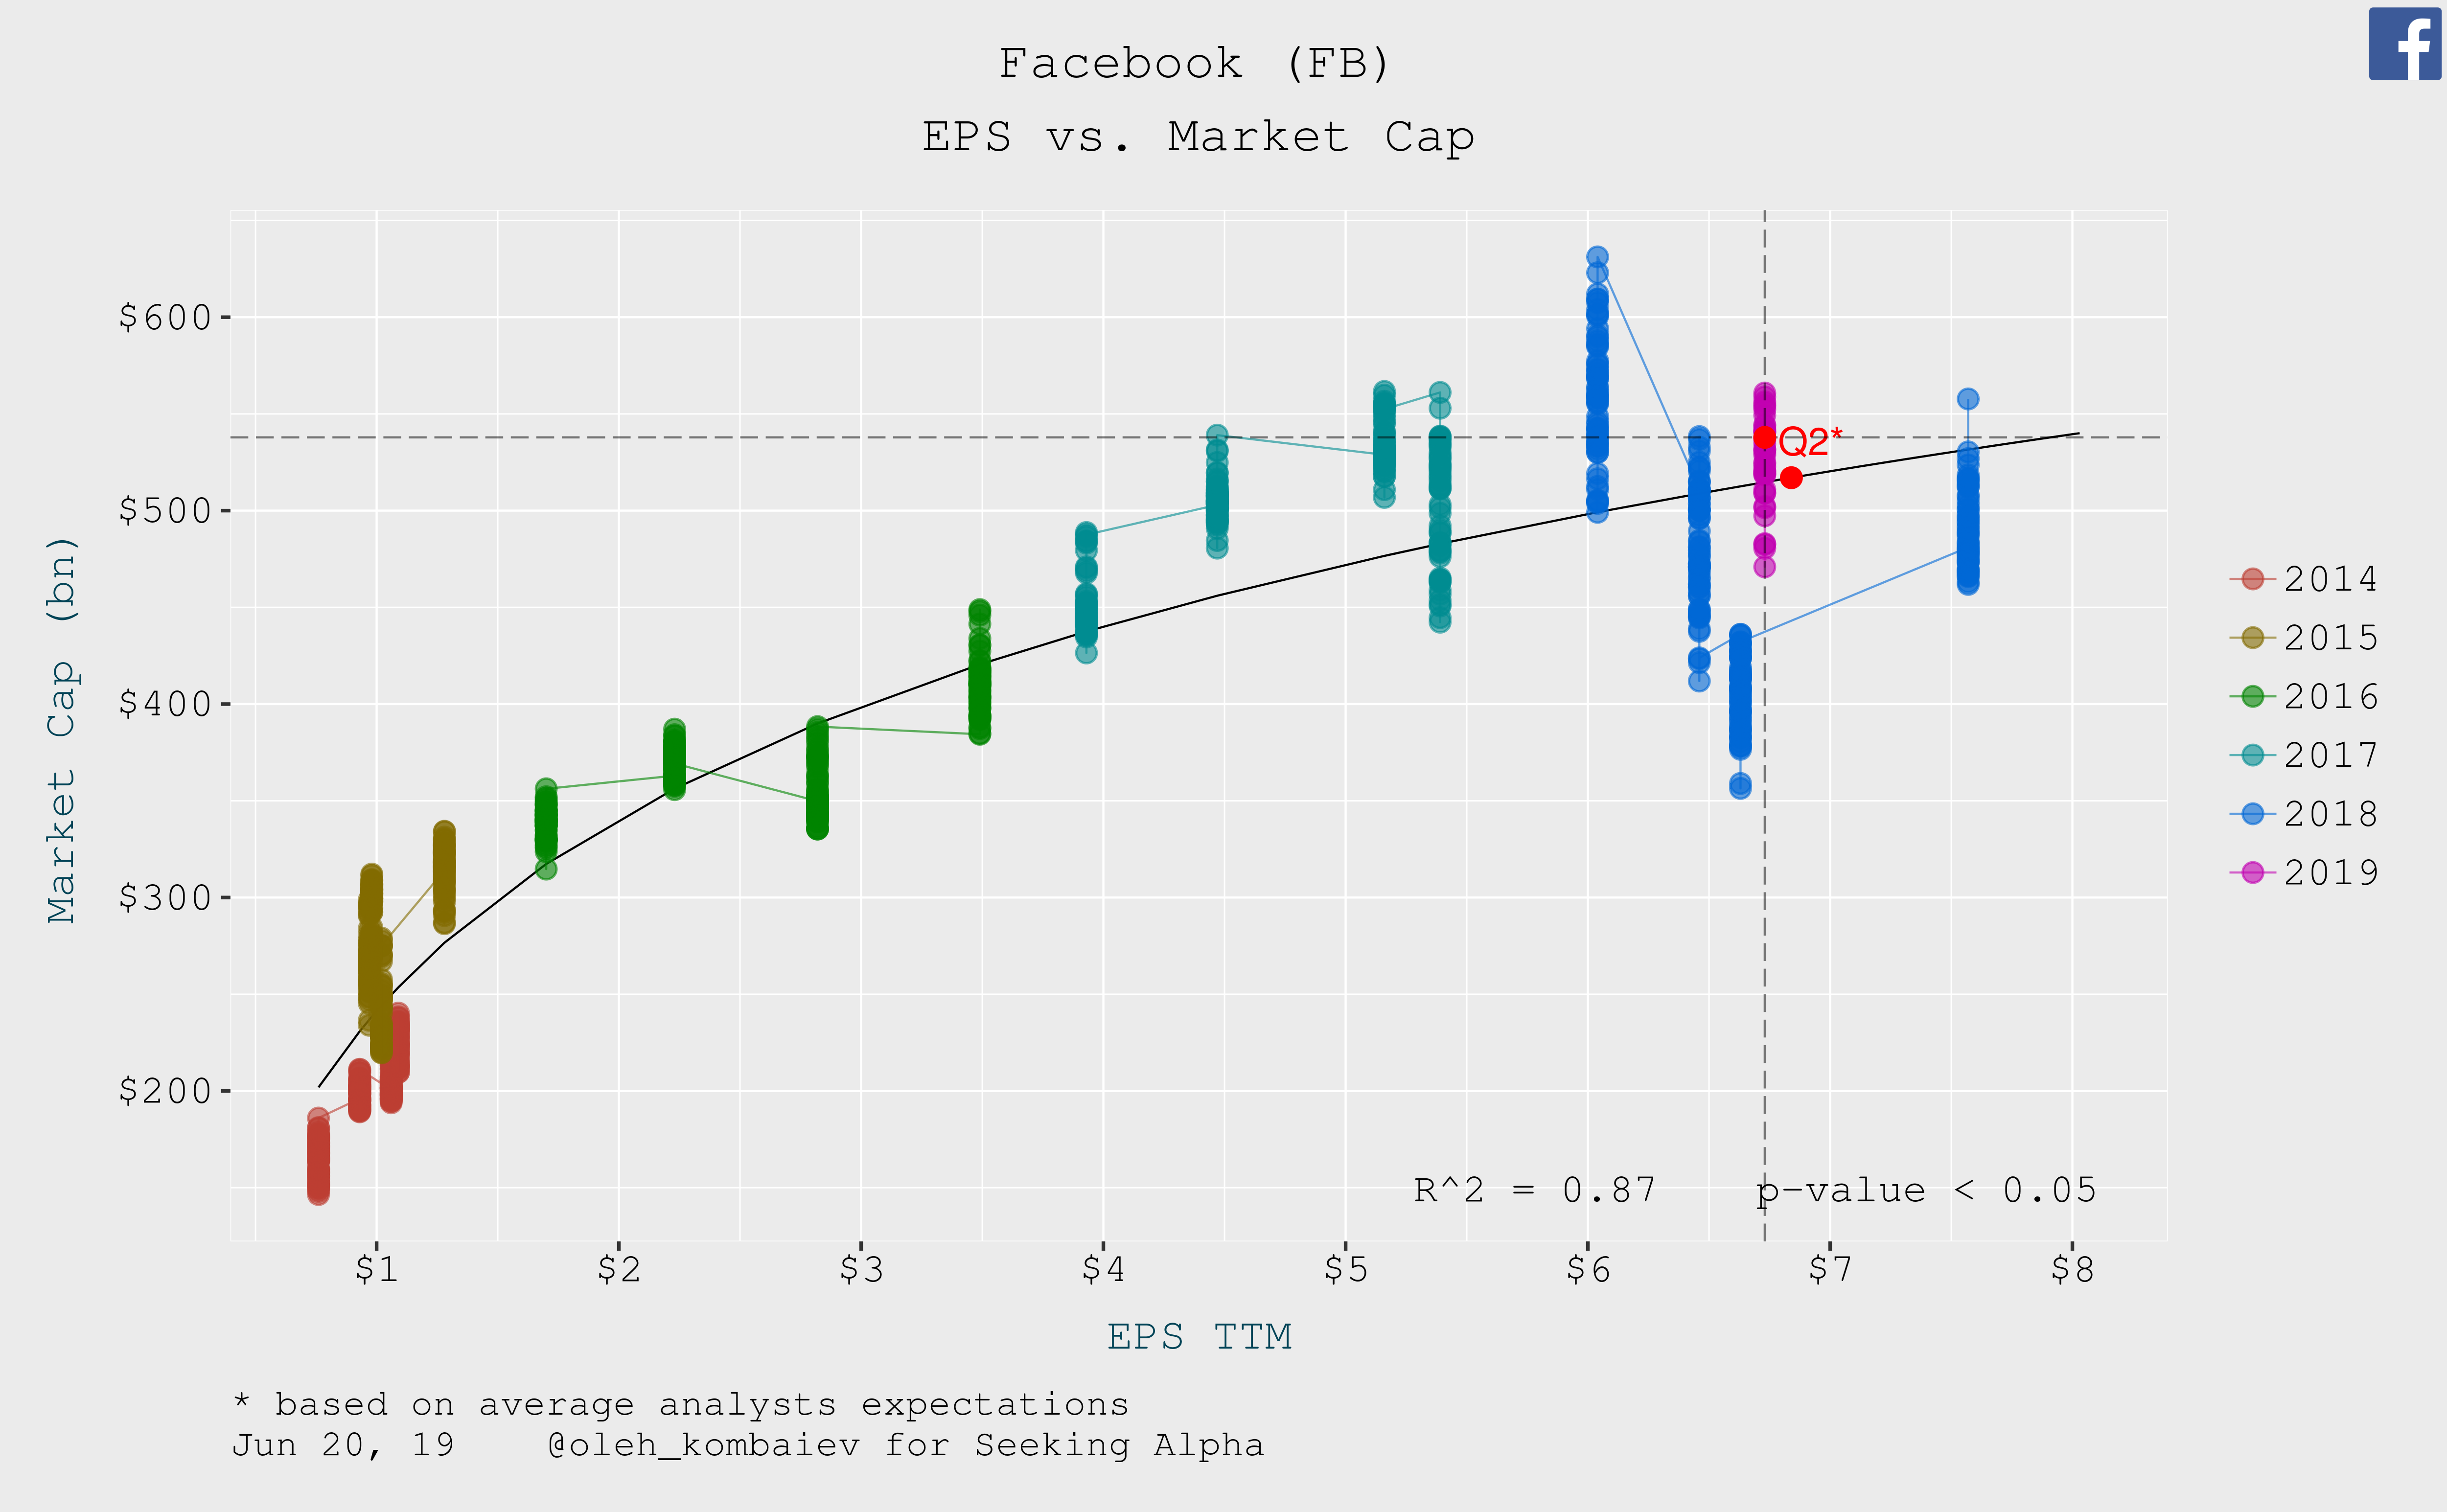
Based on the long-term relationship between the EPS TTM absolute size and the company's capitalization, Facebook's current price is balanced too:
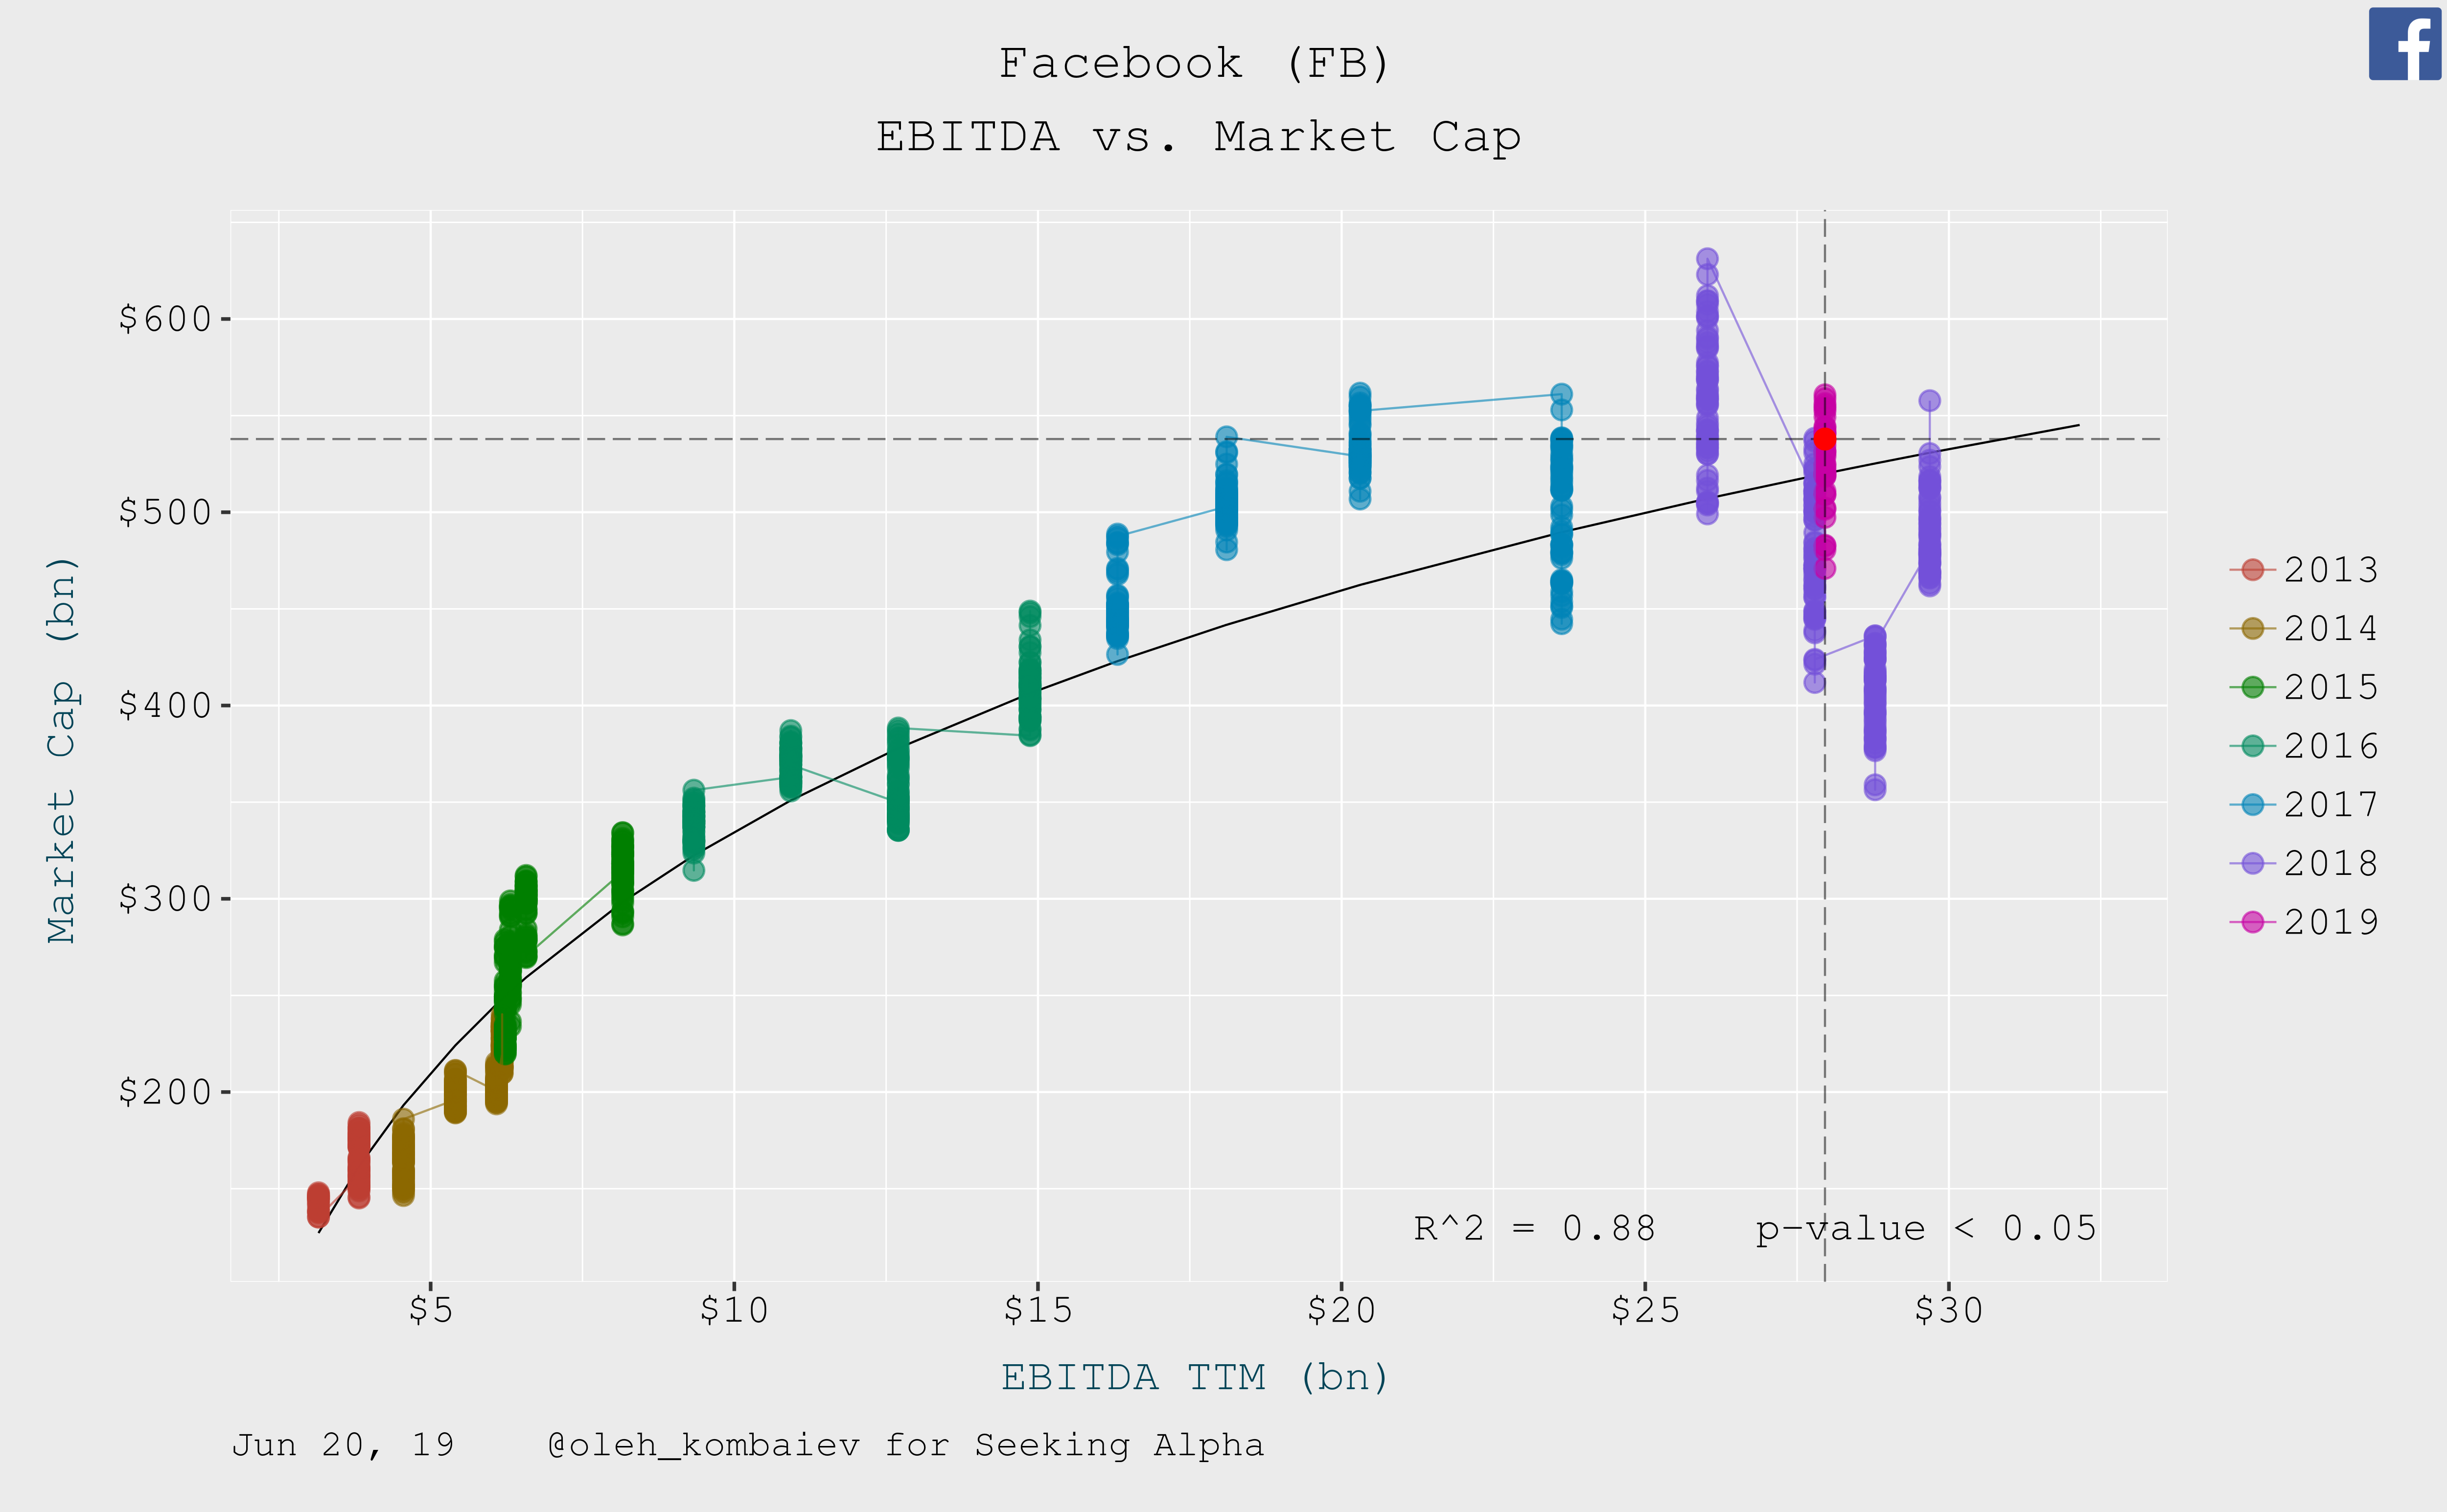
We can make the same conclusion analyzing the long-term relationship between EBITDA's absolute size and the company's capitalization:
Now let's talk about Facebook in terms of the growth rates of its financial indicators.
The two-year CAGR of Facebook's revenue TTM has slowed down to a historical minimum. But given the fact that this is accompanied by a decrease