
Race car driver Mikaela Ahlin-Kottulinsky and her helmet (photo via Forbes).
Bulletproof Investing: Week 83 Performance
Each week since the beginning of June 2017, I have presented at least two hedged portfolios created by Portfolio Armor to my Bulletproof Investing subscribers. This is an "investing with a helmet on" approach, and these portfolios are designed to last six months at most. As with any investment method, the returns with this approach will vary. But in the interests of transparency and accountability, I have promised to publicly share the final performance of everything I present, regardless of how it does.
Here, I update the final performance of the five hedged portfolios and the top 10 names (unhedged) that I presented in the 83rd week I offered my service. Let's look at what I presented in week 83 and how it did.
Portfolio 1
This was the $30,000 portfolio. The primary securities here were Starbucks (SBUX) and the ProShares UltraShort Bloomberg Oil & Gas ETF (DUG). They were selected because they had the highest potential return estimates, net of hedging costs when hedging against >13% declines, and they had share prices low enough that you could buy round lots of them for less than $10,000. Twilio (TWLO) was added in a fine-tuning step to absorb leftover cash from rounding down to round lots of the first two names (I address the inclusion of bearish ETFs in my assessment of this cohort below).
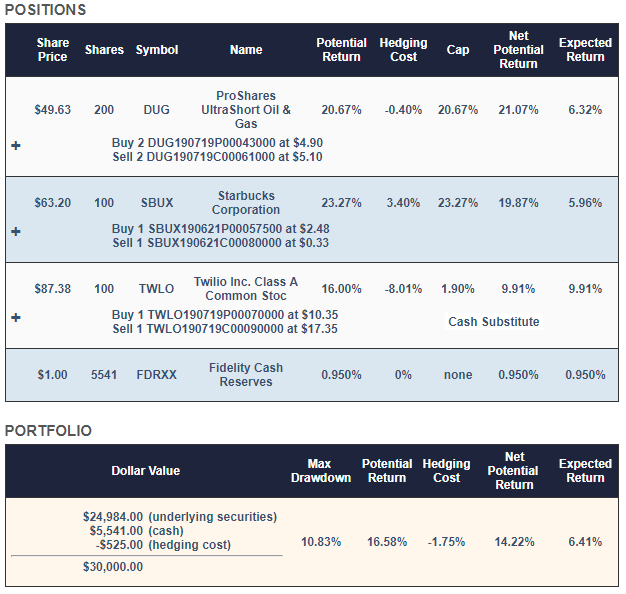
The image above was generated by Portfolio Armor on December 27th and presented in this Marketplace post at the time.
The worst-case scenario for this portfolio was a decline of 10.83% (the "max drawdown") and the best-case scenario was a gain of 14.22% (the "Net Potential Return" or aggregate potential return net of hedging cost). The "Expected Return" of 6.41% was a ballpark estimate, taking into account the historic relationship between actual returns and Portfolio Armor's potential return estimates.
Portfolio 1 Performance
Here's how the portfolio did, net of hedging and trading costs.


This portfolio was up 4.36%, underperforming its expected return and the SPDR S&P 500 Trust ETF (SPY), but generating a decent return considering the bearish ETF it held (more on that in our assessment below).
So far, we have six-month performance data for 31 portfolios I've presented that were hedged against >13% declines. Here's how all of them have done (click on a starting date to go to an interactive version of that chart).
Portfolios Hedged Against > 13.0% Declines
| Starting Date | Expected Return | Actual Return | SPY Return |
|---|---|---|---|
| February 8, 2018 | 6.57% | 5.29% | 11.75% |
| June 7, 2018 | 8.18% | -8.90% | -4.12% |
| June 14, 2018 | 12.69% | -7.07% | -5.71% |
| June 21, 2018 | 11.30% | -7.14% | -11.31% |
| June 28, 2018 | 11.89% | -5.45% | -7.58% |
| July 5, 2018 | 9.79% | -2.85% | -6.61% |
| July 12, 2018 | 10.38% | -8.45% | -6.32% |
| July 19, 2018 | 10.89% | -10.78% | -3.83% |
| July 26, 2018 | 7.49% | -9.83% | -5.21% |
| August 2, 2018 | 11.71% | -7.39% | -3.36% |
| August 9, 2018 | 11.80% | -2.21% | -4.12% |
| August 16, 2018 | 15.01% | 2.44% | -1.33% |
| August 23, 2018 | 11.01% | -6.89% | -1.30% |
| August 30, 2018 | 12.71% | -7.43% | -2.99% |
| September 6, 2018 | 13.82% | -7.66% | -2.75% |
| September 13, 2018 | 17.20% | -4.31% | -2.25% |
| September 20, 2018 | 14.27% | 1.95% | -2.66% |
| September 27, 2018 | 13.66% | -3.84% | -2.80% |
| October 4, 2018 | 10.52% | 8.56% | 0.25% |
| October 11, 2018 | 8.33% | 2.26% | 6.99% |
| October 18, 2018 | 9.07% | -1.54% | 6.02% |
| October 25, 2018 | 6.61% | -5.75% | 9.26% |
| November 1, 2018 | 8.44% | 6.78% | 7.80% |
| November 8, 2018 | 9.64% | 4.18% | 3.57% |
| November 15, 2018 | 8.21% | 1.09% | 5.49% |
| November 21, 2018 | 9.42% | 6.55% | 9.23% |
| November 29, 2018 | 11.49% | 19.01% | 2.62% |
| December 6, 2018 | 9.02% | 0.03% | 6.64% |
| December 13, 2018 | 8.52% | 0.27% | 10.26% |
| December 20, 2018 | 5.39% | 1.07% | 20.94% |
| December 27, 2018 | 6.41% | 4.36% | 18.60% |
| Average | 10.37% | -1.41% | 1.46% |
Table via Portfolio Armor
Portfolio 2
This was the $100k portfolio. This one included DUG, McCormick (MKC), Spirit Airlines (SAVE), and Starbucks (SBUX), as primary securities. TWLO was added in the fine-tuning step again to absorb cash left over from the process of rounding down to round lots of the primary securities.


The image above was generated by Portfolio Armor on December 27 and presented in this Marketplace post at the time.
The worst-case scenario for this one was a decline of 13.46%, the best-case scenario was a gain of 16,77%, and the ballpark estimate of an expected return was 6.88%.
Portfolio 2 Performance
Here's how the portfolio did, net of hedging and trading costs.


This one was up 3.98%. So far, we have six-month performance data for 37 portfolios I've presented hedged against >14% declines. Here's how all of them have done (click on a starting date to go to an interactive version of that chart).
Portfolios Hedged Against > 14.0% Declines
| Starting Date | Expected Return | Actual Return | SPY Return |
|---|---|---|---|
| December 28, 2017 | 9.33% | 9.95% | 1.99% |
| January 18, 2018 | 9.32% | 9.65% | 1.55% |
| January 25, 2018 | 9.33% | 5.65% | 1.10% |
| February 8, 2018 | 6.21% | 6.58% | 11.75% |
| February 15, 2018 | 6.95% | -8.55% | 4.08% |
| February 15, 2018 | 8.37% | -6.65% | 4.08% |
| May 24, 2018 | 11.16% | -7.08% | -2.63% |
| May 24, 2018 | 10.19% | -3.39% | -2.63% |
| May 31, 2018 | 6.97% | -1.57% | 2.66% |
| June 7, 2018 | 7.11% | -4.27% | -4.12% |
| June 14, 2018 | 12.74% | -6.08% | -5.71% |
| June 21, 2018 | 12.38% | -10.71% | -11.31% |
| June 28, 2018 | 11.20% | -7.76% | -7.58% |
| July 5, 2018 | 9.16% | -5.18% | -6.61% |
| July 12, 2018 | 10.90% | -7.76% | -6.32% |
| July 19, 2018 | 10.57% | -10.43% | -3.83% |
| July 26, 2018 | 8.99% | -6.50% | -5.21% |
| August 2, 2018 | 10.75% | -8.11% | -3.36% |
| August 9, 2018 | 11.25% | -2.06% | -4.12% |
| August 16, 2018 | 14.23% | -2.27% | -1.33% |
| August 23, 2018 | 13.43% | 0.67% | -1.30% |
| August 30, 2018 | 12.07% | -8.29% | -2.99% |
| September 6, 2018 | 15.29% | -8.61% | -2.75% |
| September 13, 2018 | 15.78% | -3.48% | -2.25% |
| September 20, 2018 | 12.31% | -2.43% | -2.66% |
| September 27, 2018 | 15.60% | -10.62% | -2.80% |
| October 4, 2018 | 9.87% | 7.16% | 0.25% |
| October 11, 2018 | 8.67% | 0.36% | 6.99% |
| October 18, 2018 | 8.77% | -2.81% | 6.02% |
| October 25, 2018 | 7.78% | 4.41% | 9.26% |
| November 1, 2018 | 9.07% | 7.97% | 7.80% |
| November 8, 2018 | 10.10% | 4.98% | 3.57% |
| November 15, 2018 | 10.85% | 6.45% | 5.49% |
| November 21, 2018 | 7.92% | 2.29% | 9.23% |
| November 29, 2018 | 12.18% | 3.69% | 2.62% |
| December 6, 2018 | 10.60% | 0.52% | 6.64% |
| December 13, 2018 | 9.09% | 0.68% | 10.26% |
| December 20, 2018 | 7.03% | 3.85% | 20.94% |
| December 27, 2018 | 6.88% | 3.98% | 18.60% |
| Average | 10.27% | -1.43% | 1.42% |
Table via Portfolio Armor
Portfolio 3
This was the $1 million portfolio. It included AutoZone (AZO), DUG, Finisar (FNSR), Eli Lilly (LLY), MKC, SBUX, and Workday (WDAY) as primary securities. TWLO was added in the fine-tuning step again to absorb cash left over from the process of rounding down to round lots of the primary securities.


The image above was generated by Portfolio Armor on December 27 and presented in this Marketplace post at the time.
The worst-case scenario here was a drawdown of 14.67%, the best-case scenario was a gain of 16.81% (the net potential return), and the expected return was 6.51%.
Portfolio 3 Performance
Here's how the portfolio did, net of hedging and trading costs.


This one was up 8.54%, outperforming its expected return of 6.51%. So far, we have six-month performance data for 55 portfolios I've presented hedged against >15% declines. Here's how all of them have done (click on a starting date to go to an interactive version of that chart).
Portfolios Hedged Against > 15.0% Declines
| Starting Date | Expected Return | Actual Return | SPY Return |
|---|---|---|---|
| April 23, 2017 | 6.74% | 15.41% | 10.25% |
| December 31, 2017 | 8.90% | 13.07% | 2.52% |
| January 29, 2018 | 8.52% | 9.88% | -0.30% |
| February 1, 2018 | 7.30% | -5.69% | 0.59% |
| February 1, 2018 | 8.70% | 0.87% | 0.59% |
| February 22, 2018 | 7.91% | 5.74% | 6.73% |
| March 1, 2018 | 7.45% | 5.80% | 9.37% |
| March 8, 2018 | 7.47% | -1.77% | 5.82% |
| March 8, 2018 | 7.73% | -4.26% | 5.82% |
| March 15, 2018 | 7.21% | -4.70% | 6.68% |
| March 15, 2018 | 7.80% | 1.73% | 6.68% |
| March 22, 2018 | 7.41% | 3.20% | 11.74% |
| March 22, 2018 | 7.40% | 5.89% | 11.74% |
| March 29, 2018 | 8.07% | 5.03% | 11.48% |
| March 29, 2018 | 7.57% | 4.47% | 11.48% |
| March 31, 2018 | 8.04% | 9.06% | 11.48% |
| April 5, 2018 | 10.57% | -1.33% | 9.33% |
| April 5, 2018 | 10.88% | -3.70% | 9.33% |
| April 12, 2018 | 9.02% | 3.66% | 4.71% |
| April 26, 2018 | 10.16% | 14.99% | 0.53% |
| April 26, 2018 | 9.78% | 5.01% | 0.53% |
| May 3, 2018 | 9.57% | 2.47% | 4.47% |
| May 10, 2018 | 8.74% | -2.96% | 3.03% |
| May 17, 2018 | 11.00% | -0.74% | 1.54% |
| May 17, 2018 | 12.15% | 4.72% | 1.54% |
| May 31, 2018 | 7.44% | -2.33% | 2.66% |
| June 7, 2018 | 8.11% | -9.65% | -4.12% |
| June 14, 2018 | 11.96% | -8.61% | -5.71% |
| June 21, 2018 | 11.49% | -11.82% | -11.31% |
| June 28, 2018 | 11.41% | -7.70% | -7.58% |
| July 5, 2018 | 8.99% | -6.88% | -6.61% |
| July 12, 2018 | 9.64% | -4.41% | -6.32% |
| July 19, 2018 | 10.59% | -10.71% | -3.83% |
| July 26, 2018 | 9.41% | -8.27% | -5.21% |
| August 2, 2018 | 9.47% | -6.12% | -3.36% |
| August 9, 2018 | 12.22% | -1.73% | -4.12% |
| August 16, 2018 | 13.82% | -0.80% | -1.33% |
| August 23, 2018 | 14.61% | -4.40% | -1.30% |
| August 30, 2018 | 12.46% | -8.91% | -2.99% |
| September 6, 2018 | 13.61% | -4.93% | -2.75% |
| September 13, 2018 | 16.43% | -5.37% | -2.25% |
| September 20, 2018 | 13.07% | -0.82% | -2.66% |
| September 27, 2018 | 14.11% | -4.31% | -2.80% |
| October 4, 2018 | 10.20% | 1.05% | 0.25% |
| October 11, 2018 | 9.01% | 4.25% | 6.99% |
| October 18, 2018 | 8.84% | 0.20% | 6.02% |
| October 25, 2018 | 8.51% | 3.56% | 9.26% |
| November 1, 2018 | 8.03% | 9.04% | 7.80% |
| November 8, 2018 | 9.13% | 1.87% | 3.57% |
| November 15, 2018 | 9.57% | 6.50% | 5.49% |
| November 21, 2018 | 8.25% | 0.59% | 9.23% |
| November 29, 2018 | 12.28% | -0.11% | 2.62% |
| December 6, 2018 | 8.80% | 1.80% | 6.64% |
| December 13, 2018 | 9.42% | -1.73% | 10.26% |
| December 20, 2018 | 6.73% | 4.24% | 20.94% |
| December 27, 2018 | 6.51% | 8.54% | 18.60% |
| Average | 9.65% | 0.32% | 3.28% |
Table via Portfolio Armor
Portfolio 4
This was the $2 million aggressive portfolio. This one included AZO, Church & Dwight (CHD), DUG, LLY, MKC, SBUX, and WDAY as primary securities. The ProShares UltraShort FTSE ETF (EPV) was added to absorb leftover cash in the fine-tuning step.


The image above was generated by Portfolio Armor on December 27 and presented in this Marketplace post at the time.
The worst-case scenario here was the max drawdown of 19.8%, the best-case scenario was the net potential return of 18.67%, and the expected return was 7.02%.
Portfolio 4 Performance
Here's how the portfolio did, net of hedging and trading costs.


This one was up 4.93%. So far, we have six-month performance data for 65 portfolios I've presented hedged against >20% declines. Here's how all of them have done (click on a starting date to go to an interactive version of that chart).
Portfolios Hedged Against > 20.0% Declines
| Starting Date | Expected Return | Actual Return | SPY Return |
|---|---|---|---|
| June 22, 2017 | 8.43% | 20.08% | 11.27% |
| August 31, 2017 | 8.03% | 9.10% | 10.87% |
| October 12, 2017 | 9.00% | 2.12% | 5.38% |
| October 19, 2017 | 10.07% | 13.05% | 6.08% |
| October 26, 2017 | 8.57% | 9.39% | 5.13% |
| November 2, 2017 | 9.77% | 10.67% | 3.11% |
| November 9, 2017 | 9.59% | 4.45% | 5.34% |
| November 16, 2017 | 8.95% | 5.18% | 6.22% |
| November 22, 2017 | 9.39% | 7.31% | 5.90% |
| November 30, 2017 | 8.55% | -4.74% | 3.80% |
| December 8, 2017 | 8.34% | 4.50% | 5.73% |
| December 14, 2017 | 7.75% | 17.49% | 5.87% |
| December 21, 2017 | 9.33% | 12.33% | 3.36% |
| December 28, 2017 | 9.92% | 9.45% | 1.99% |
| January 4, 2018 | 9.65% | 12.92% | 0.59% |
| January 11, 2018 | 8.93% | 9.14% | 1.12% |
| January 18, 2018 | 9.40% | 7.89% | 1.55% |
| January 25, 2018 | 9.82% | 6.19% | 1.10% |
| January 29, 2018 | 9.29% | 10.48% | -0.30% |
| February 1, 2018 | 9.00% | 0.84% | 0.59% |
| February 8, 2018 | 7.35% | 12.49% | 11.75% |
| February 15, 2018 | 8.19% | -6.14% | 4.08% |
| February 22, 2018 | 8.54% | 6.90% | 6.73% |
| March 1, 2018 | 7.98% | 6.66% | 9.37% |
| March 8, 2018 | 8.32% | -3.20% | 5.82% |
| March 15, 2018 | 7.90% | 2.50% | 6.68% |
| March 22, 2018 | 7.65% | 8.82% | 11.74% |
| March 22, 2018 | 7.62% | 9.58% | 11.74% |
| March 29, 2018 | 8.26% | 7.72% | 11.48% |
| April 5, 2018 | 10.59% | 0.20% | 9.33% |
| April 12, 2018 | 9.36% | 4.63% | 4.71% |
| April 19, 2018 | 11.04% | 17.36% | 3.67% |
| April 26, 2018 | 10.32% | 17.44% | 0.53% |
| May 3, 2018 | 10.08% | 7.54% | 4.47% |
| May 10, 2018 | 8.64% | 2.61% | 3.03% |
| May 17, 2018 | 11.53% | -4.37% | 1.54% |
| May 24, 2018 | 11.74% | -6.80% | -2.63% |
| May 31, 2018 | 7.76% | -4.70% | 2.66% |
| June 7, 2018 | 8.62% | -11.51% | -4.12% |
| June 14, 2018 | 13.05% | -9.78% | -5.71% |
| June 21, 2018 | 12.44% | -17.22% | -11.31% |
| June 28, 2018 | 11.80% | -7.95% | -7.58% |
| July 5, 2018 | 9.11% | -13.03% | -6.61% |
| July 12, 2018 | 9.97% | -8.37% | -6.32% |
| July 19, 2018 | 10.82% | -10.54% | -3.83% |
| July 26, 2018 | 9.87% | -6.70% | -5.21% |
| August 2, 2018 | 9.76% | -3.91% | -3.36% |
| August 9, 2018 | 12.78% | -1.44% | -4.12% |
| August 16, 2018 | 14.60% | 0.79% | -1.33% |
| August 23, 2018 | 15.20% | 0.71% | -1.30% |
| August 30, 2018 | 13.16% | -7.98% | -2.99% |
| September 6, 2018 | 13.66% | -4.72% | -2.75% |
| September 13, 2018 | 17.32% | -5.23% | -2.25% |
| September 20, 2018 | 13.73% | -0.28% | -2.66% |
| September 27, 2018 | 14.71% | -7.29% | -2.80% |
| October 4, 2018 | 10.11% | -0.33% | 0.25% |
| October 11, 2018 | 9.61% | 4.16% | 6.99% |
| October 18, 2018 | 9.03% | 5.07% | 6.02% |
| October 25, 2018 | 9.45% | -0.89% | 9.26% |
| November 1, 2018 | 8.12% | 9.46% | 7.80% |
| November 8, 2018 | 9.33% | 2.52% | 3.57% |
| November 15, 2018 | 9.78% | 7.03% | 5.49% |
| November 21, 2018 | 8.95% | 6.12% | 9.23% |
| November 29, 2018 | 13.02% | 0.82% | 2.62% |
| December 6, 2018 | 9.15% | 2.26% | 6.64% |
| December 13, 2018 | 9.97% | -1.15% | 10.26% |
| December 20, 2018 | 7.73% | -2.06% | 20.94% |
| December 27, 2018 | 7.02% | 4.93% | 18.60% |
| Average | 9.95% | 2.51% | 3.31% |
Table via Portfolio Armor
Portfolio 5
This was the $2 million top names portfolio. A name that appeared in this portfolio but not in the previous December 27 portfolios was Barrick Gold (then ABX, now (GOLD)).


The image above was generated by Portfolio Armor on December 27 and presented in this Marketplace post at the time.
The worst-case scenario was a drawdown of 8.6%, the best-case scenario was a gain of 13.05%, and the expected return was 4.67%.
Portfolio 5 Performance
Here's how the portfolio did, net of hedging and trading costs.


This portfolio was up 3.44%. So far, we have a full six-month performance for 81 portfolios I've presented hedged against >9% declines. Here's how each of them did (click on a starting date to go to an interactive version of that chart).
Portfolios Hedged Against > 9.0% Declines
| Starting Date | Expected Return | Actual Return | SPY Return |
|---|---|---|---|
| June 8, 2017 | 6.11% | 9.25% | 9.99% |
| June 16, 2017 | 5.13% | 11.59% | 10.94% |
| June 22, 2017 | 5.43% | 13.88% | 11.27% |
| June 29, 2017 | 6.72% | 12.92% | 11.68% |
| July 7, 2017 | 6.29% | 8.40% | 14.07% |
| July 13, 2017 | 6.70% | 12.96% | 14.85% |
| July 20, 2017 | 6.57% | 10.34% | 14.62% |
| July 27, 2017 | 5.61% | 8.20% | 17.10% |
| August 3, 2017 | 8.84% | 13.98% | 12.66% |
| August 3, 2017 | 8.46% | 16.52% | 12.66% |
| August 10, 2017 | 6.15% | 4.05% | 8.36% |
| August 17, 2017 | 7.06% | 9.41% | 13.48% |
| August 17, 2017 | 8.11% | 9.12% | 13.48% |
| August 24, 2017 | 6.79% | 8.97% | 13.72% |
| August 31, 2017 | 7.43% | 4.65% | 10.87% |
| September 7, 2017 | 6.33% | 9.51% | 11.61% |
| September 14, 2017 | 7.25% | 11.27% | 11.19% |
| September 22, 2017 | 6.41% | 10.55% | 6.67% |
| September 28, 2017 | 6.27% | 8.35% | 4.73% |
| October 5, 2017 | 8.36% | 8.68% | 5.26% |
| October 5, 2017 | 7.33% | 4.62% | 5.26% |
| October 12, 2017 | 6.58% | 5.10% | 5.38% |
| October 19, 2017 | 7.91% | 9.63% | 6.08% |
| October 26, 2017 | 7.63% | 9.34% | 5.13% |
| November 2, 2017 | 6.15% | 4.72% | 3.11% |
| November 9, 2017 | 7.09% | -1.48% | 5.34% |
| November 16, 2017 | 7.13% | 8.93% | 6.22% |
| November 22, 2017 | 6.76% | -0.85% | 5.90% |
| November 30, 2017 | 6.53% | -1.80% | 3.80% |
| December 8, 2017 | 5.10% | 4.88% | 5.73% |
| December 14, 2017 | 6.75% | 13.47% | 5.87% |
| December 14, 2017 | 6.15% | 12.47% | 5.87% |
| December 21, 2017 | 6.70% | 0.83% | 3.36% |
| December 28, 2017 | 7.70% | 14.94% | 1.99% |
| December 28, 2017 | 7.88% | 6.19% | 1.99% |
| January 4, 2018 | 9.30% | 15.12% | 0.59% |
| January 4, 2018 | 8.65% | 10.83% | 0.59% |
| January 11, 2018 | 7.59% | -2.69% | 1.12% |
| January 18, 2018 | 6.81% | -0.21% | 1.55% |
| January 25, 2018 | 8.66% | 3.47% | 1.10% |
| February 1, 2018 | 6.59% | 1.69% | 0.59% |
| February 8, 2018 | 4.74% | 8.07% | 11.75% |
| February 15, 2018 | 6.37% | -2.10% | 4.08% |
| February 22, 2018 | 5.44% | 1.72% | 6.73% |
| March 1, 2018 | 5.05% | 4.68% | 9.37% |
| March 8, 2018 | 6.39% | -3.81% | 5.82% |
| March 15, 2018 | 5.23% | 1.31% | 6.68% |
| March 22, 2018 | 5.98% | 4.01% | 11.74% |
| March 29, 2018 | 5.93% | 4.77% | 11.48% |
| April 5, 2018 | 6.91% | 3.35% | 9.33% |
| April 12, 2018 | 8.35% | -0.64% | 4.71% |
| April 12, 2018 | 9.09% | -2.72% | 4.71% |
| April 19, 2018 | 9.66% | -4.07% | 3.67% |
| April 19, 2018 | 8.86% | 1.04% | 3.67% |
| April 26, 2018 | 7.72% | 7.56% | 0.53% |
| April 26, 2018 | 7.33% | 5.67% | 0.53% |
| May 3, 2018 | 8.33% | 1.96% | 4.47% |
| May 3, 2018 | 10.67% | -1.73% | 4.47% |
| May 10, 2018 | 7.96% | 2.84% | 3.03% |
| May 17, 2018 | 7.87% | 0.60% | 1.54% |
| May 24, 2018 | 8.65% | -5.27% | -2.63% |
| May 31, 2018 | 6.22% | -0.19% | 2.66% |
| June 7, 2018 | 7.23% | -6.52% | -4.12% |
| June 14, 2018 | 9.44% | -4.69% | -5.71% |
| June 21, 2018 | 9.35% | -7.29% | -11.31% |
| June 28, 2018 | 7.13% | -7.56% | -7.58% |
| July 5, 2018 | 7.70% | -5.45% | -6.61% |
| July 12, 2018 | 8.22% | -6.77% | -6.32% |
| July 19, 2018 | 7.21% | -5.21% | -3.83% |
| July 26, 2018 | 6.47% | -5.21% | -5.21% |
| August 2, 2018 | 7.71% | -0.32% | -3.36% |
| August 9, 2018 | 11.83% | -0.96% | -4.12% |
| August 16, 2018 | 10.73% | -5.46% | -1.33% |
| August 23, 2018 | 9.69% | -3.52% | -1.30% |
| August 30, 2018 | 10.23% | -7.59% | -2.99% |
| September 6, 2018 | 10.52% | -6.09% | -2.75% |
| September 13, 2018 | 9.17% | -3.47% | -2.25% |
| September 20, 2018 | 9.31% | -1.86% | -2.66% |
| September 27, 2018 | 9.98% | -5.35% | -2.80% |
| October 4, 2018 | 6.98% | -1.76% | 0.25% |
| October 11, 2018 | 6.78% | 4.03% | 6.99% |
| October 18, 2018 | 8.29% | 1.97% | 6.02% |
| October 25, 2018 | 6.43% | 1.78% | 9.26% |
| November 1, 2018 | 6.27% | 4.74% | 7.80% |
| November 8, 2018 | 8.35% | -2.01% | 3.57% |
| November 15, 2018 | 7.87% | 0.16% | 5.49% |
| November 21, 2018 | 7.21% | 2.16% | 9.23% |
| November 29, 2018 | 9.54% | -1.05% | 2.62% |
| December 6, 2018 | 7.78% | -0.60% | 6.64% |
| December 13, 2018 | 7.37% | -3.27% | 10.26% |
| December 20, 2018 | 3.99% | 3.10% | 20.94% |
| December 27, 2018 | 4.67% | 3.44% | 18.60% |
| Average | 7.43% | 3.02% | 4.86% |
Table via Portfolio Armor
One note about the table above: It includes both $100k portfolios and $1M portfolios. Starting with the May 24 cohort, I began presenting $100k portfolios hedged against >14% declines, so they appear in a different table from that point forward. My guess is that will slightly improve the average performance of the portfolios hedged against >9% declines.
Top Names
These were Portfolio Armor's top 10 names as of December 27. Names that didn't appear in the portfolios above were the ProShares UltraPro Short Russell 2000 ETF, Ball Corporation (BLL), and Merck (MRK).

The image above was generated by Portfolio Armor on December 27 and was included in the same Marketplace post as the top names portfolio above.
For this cohort, as of December 20:
- Average 36M Beta = 0.7
- Average 20% threshold optimal put hedging cost: 2.8%
Top Names Performance
Here's how the top names did:

The top names (unhedged) were up 7.41% on average vs. up 18.6% for SPY. So far, 46 top names/cohorts have beaten SPY, one has tied SPY, and 35 have underperformed SPY over the next six months. You can see the performance for all of the top name cohorts I've presented so far in the table below (click on a starting date to go to an interactive version of that chart).
| Starting Date | Portfolio Armor 6-Month Performance | SPY 6-Month Performance |
|---|---|---|
| June 8, 2017 | 14.49% | 9.99% |
| June 15, 2017 | 19.85% | 10.97% |
| June 22, 2017 | 24.46% | 11.27% |
| June 29, 2017 | 18.24% | 11.68% |
| July 6, 2017 | 21.03% | 14.81% |
| July 13, 2017 | 28.25% | 14.85% |
| July 20, 2017 | 25.04% | 14.62% |
| July 27, 2017 | 33.52% | 17.10% |
| August 3, 2017 | 20.72% | 12.66% |
| August 10, 2017 | 13.05% | 8.36% |
| August 17, 2017 | 10.71% | 13.48% |
| August 24, 2017 | 15.23% | 13.72% |
| August 31, 2017 | 8.42% | 10.87% |
| September 7, 2017 | 12.75% | 11.61% |
| September 14, 2017 | 29.19% | 11.19% |
| September 21, 2017 | 22.56% | 9.42% |
| September 28, 2017 | 14.30% | 4.73% |
| October 5, 2017 | 11.53% | 5.26% |
| October 12, 2017 | 15.46% | 5.38% |
| October 19, 2017 | 20.73% | 6.08% |
| October 26, 2017 | 18.10% | 5.13% |
| November 2, 2017 | 12.64% | 3.11% |
| November 9, 2017 | 5.41% | 5.34% |
| November 16, 2017 | 6.11% | 6.22% |
| November 23, 2017 | 5.18% | 6.19% |
| November 30, 2017 | -0.19% | 3.80% |
| December 7, 2017 | 11.51% | 5.99% |
| December 14, 2017 | 29.80% | 5.87% |
| December 21, 2017 | 17.11% | 3.36% |
| December 28, 2017 | 13.78% | 1.99% |
| January 4, 2018 | 30.22% | 0.59% |
| January 11, 2018 | -2.06% | 1.12% |
| January 18, 2018 | 7.00% | 1.55% |
| January 25, 2018 | 1.73% | 1.10% |
| February 1, 2018 | 11.02% | 0.59% |
| February 8, 2018 | 25.21% | 11.75% |
| February 15, 2018 | 4.31% | 4.08% |
| February 22, 2018 | 19.48% | 6.73% |
| March 1, 2018 | 10.64% | 9.37% |
| March 8, 2018 | 5.82% | 5.82% |
| March 15, 2018 | 6.99% | 6.68% |
| March 22, 2018 | 8.64% | 11.74% |
| March 29, 2018 | 14.68% | 11.48% |
| April 5, 2018 | 9.76% | 9.33% |
| April 12, 2018 | -2.29% | 4.71% |
| April 19, 2018 | 4.66% | 3.67% |
| April 26, 2018 | 2.30% | 0.53% |
| May 3, 2018 | 10.96% | 4.47% |
| May 10, 2018 | 7.01% | 3.03% |
| May 17, 2018 | -6.70% | 1.54% |
| May 24, 2018 | -5.60% | -2.63% |
| May 31, 2018 | -7.91% | 2.66% |
| June 7, 2018 | -14.13% | -4.12% |
| June 14, 2018 | -2.98% | -5.71% |
| June 21, 2018 | -24.51% | -11.31% |
| June 28, 2018 | -23.86% | -7.58% |
| July 5, 2018 | -18.58% | -6.61% |
| July 12, 2018 | -9.02% | -6.32% |
| July 19, 2018 | -13.53% | -3.83% |
| July 26, 2018 | -11.30% | -5.21% |
| August 2, 2018 | -9.38% | -3.36% |
| August 9, 2018 | -6.62% | -4.12% |
| August 16, 2018 | -7.01% | -1.33% |
| August 23, 2018 | -5.88% | -1.30% |
| August 30, 2018 | -9.88% | -2.99% |
| September 6, 2018 | -9.20% | -2.75% |
| September 13, 2018 | -5.19% | -2.25% |
| September 20, 2018 | 1.58% | -2.66% |
| September 27, 2018 | 0.20% | -2.80% |
| October 4, 2018 | 5.54% | 0.25% |
| October 11, 2018 | 8.88% | 6.99% |
| October 18, 2018 | -5.10% | 6.02% |
| October 25, 2018 | 5.28% | 9.26% |
| November 1, 2018 | 5.29% | 7.80% |
| November 8, 2018 | -0.72% | 3.57% |
| November 15, 2018 | 2.10% | 5.49% |
| November 21, 2018 | 10.46% | 9.23% |
| November 29, 2018 | -3.16% | 2.62% |
| December 6, 2018 | 2.08% | 6.64% |
| December 13, 2018 | 7.15% | 10.26% |
| December 20, 2018 | 19.17% | 20.94% |
| December 27, 2018 | 7.41% | 18.60% |
| Average | 6.71% | 4.86% |
Table via Portfolio Armor
So, Portfolio Armor's top ten names averaged 6.71% over the average of these 82 6-month periods, versus SPY's average of 4.86%, an average outperformance of 1.85% over 6 months, or 3.7% annualized.
Top Names Time-Stamped
For a few months, in addition to posting those top names in my Seeking Alpha Marketplace service, I also time-stamped them on Twitter. If you click on the tweet shown below and scroll down, it will take you to a thread showing those time-stamped posts as well as charts of their subsequent performance.
Week 83 Assessment
The top 10 names (unhedged) were positive but underperformed SPY for the 35th time out of 82 weeks (we didn't post the top 10 in week 1), none of the five portfolios posted negative returns, none outperformed SPY, and one outperformed its expected return. As I mentioned last week, it's worth bearing in mind here that December was an inflection point in the market: late December was the market bottom, and at that point, it wasn't clear whether we'd slide into an extended bear market or rebound. So Portfolio Armor's portfolio construction algorithm tried to hedge its bets in that regard, in particular by including bearish ETFs and the results were better than I would have expected, to be honest, in that all of these portfolios posted positive returns. Similarly, the top names had a positive average return, despite the drag of the leveraged bearish ETF SRTY, which was down more than 40%.
Free Two Week Trial To Bulletproof Investing
To see this week's top names and hedged portfolios, you can sign up for a free two-week trial here.