
A Walgreens in a Realty Income-owned location (image via Kiplinger). Walgreens is Realty Income's largest tenant by percent of revenue.
Realty Income And The Hedged Portfolio Method
One of the great new tools Seeking Alpha has added to its Essential offering is its Quant ratings, which take into account value, growth, profitability, momentum, and EPS revisions. Unfortunately, we don't currently have a quant rating for Realty Income (NYSE:O), but we do have ratings from Seeking Alpha authors and from Wall Street's sell-side analysts. As you can see below, in aggregate, they're both neutral on the REIT.

Given the range of ratings here, and given that Realty Income, a staid REIT, has returned more than 57% since early 2018...
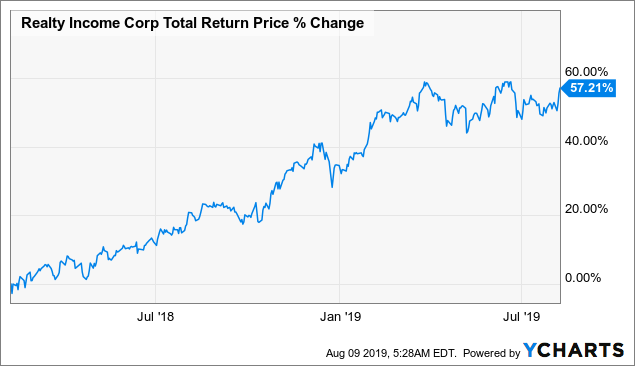 Data by YCharts
...I thought it was an interesting candidate for a bulletproof, or hedged, portfolio. As we did in previous examples, we'll use the Hedged Portfolio Method to build a concentrated portfolio around Realty Income.
We'll start with these premises:
- You have $500,000 to invest.
- You are unwilling to risk a drawdown of more than 16% over the next six months, so you want to be hedged against any decline greater than that.
- You want to invest in a handful of names, including Realty Income, with a goal of maximizing your expected total return net of hedging costs.
Here's a recap of the steps involved if you want to do this manually.
Step 1: Estimate Potential Returns
The goal of this step is to find names that have the potential to generate high total returns to include alongside O - whether those returns come partly from dividends or not isn't relevant (tax considerations aside). My site calculates its own potential returns by analyzing total returns and options market sentiment, but you can derive yours from Wall Street price targets or the price targets given by Seeking Alpha contributors you follow, if you like. Your initial universe can be as big as my system's (the ~4,500 stocks and exchange-traded products with options traded on them in the U.S.) or something smaller, such as the Dow 30.
Step 2: Calculate Hedging Costs
Since you're going to hedge, gross potential returns are less important to you than potential returns net of hedging costs. To figure those out, you need to figure out the optimal or least expensive way to hedge each name. We wrote about how to find optimal hedges here. For this example, you would be looking for the cost of hedging against declines of 16% or greater. The lower the decline you're looking to hedge against, the narrower the list of names you'll be able to use.
Step 3: Rank Names By Net Potential Return
For each of the names in your initial universe that has a positive potential return, you'll want to subtract the hedging cost you calculated in Step 2 to get a net potential return.
Step 4: Buy And Hedge
Here, you simply buy and hedge a handful of names that had the highest potential returns net of hedging costs. The automated approach I'll show below includes a fine-tuning step to minimize your cash and to determine whether to hedge each position with puts or collars, but these four steps are the basics.
An Automated Approach
Here's how the process looks using my site's automated hedged portfolio construction tool.
First, we enter "O" in the optional tickers field, along with the dollar amount we're looking to invest ($500,000) and the maximum decline we're willing to risk (16%).

Screen capture via Portfolio Armor
After clicking "Next," we see the screen below, where we're asked if we want to enter our own potential return for O. That's optional, so I leave it blank, and let the site use its own potential return estimate.

Screen capture via Portfolio Armor
Next, I click "Create," and, after a few moments, I'm presented with this hedged portfolio:


Screen capture via Portfolio Armor
In addition to O, the site selected Armstrong World Industries (AWI), TopBuild (BLD), MarketAxess (MKTX), Ferrari (RACE), and Tyson Foods (TSN) as primary securities, based on their net potential returns when hedged against >16% declines. The site attempted to allocate roughly equal dollar amounts to each of those names, but rounded down the dollar amounts to make sure it had round lots of each stock.
In its fine-tuning step, it selected The Trade Desk (TTD) to absorb cash left over from the process of rounding down the primary securities. TTD is hedged with an optimal, or least expensive, collar with a cap set at the current seven-day (annual) yield of the Fidelity Government Cash Reserves Money Market Fund (FDRXX). The hedging cost of this is negative: The idea here is to get a shot at a higher return than cash while lowering the overall hedging cost of the portfolio and limiting your downside risk in accordance with your risk tolerance (to a drawdown of no more than 16%).
If you're curious why there are so few positions in this portfolio, the short answer is that hedging obviates the need for more and enables a winning position to have a larger impact on portfolio returns. For a longer answer, this article offers an elaboration and an example.
Note that each of the primary securities is hedged with optimal puts. Here's an expanded look at the O optimal puts:

Screen capture via Portfolio Armor
As you can see, the cost of the Realty Income hedge (calculated conservatively, using the ask price of the puts, and the bid price of the calls) was equal to 2.01% of position value.
The hedged portfolio construction tool tries hedging each primary security with both an optimal collar and optimal puts, estimating the net potential return both ways, taking into account the historical incidence of outliers. Essentially, the lower hedging cost of collars is weighed against the chance for higher upside when hedging with puts. In the case of O and the other primary securities this time, the optimal collar won out.
Portfolio Characteristics
Here's a closer look at the data summary at the bottom of this portfolio:

Screen capture via Portfolio Armor
The Worst-Case Scenario
The Max Drawdown is the worst-case scenario. That's what would happen if each of the underlying securities went to $0 before their hedges expired (the idea is to hold each position for six months or until just before its hedge expires, whichever comes first). In that case, you'd be down no more than 14.93%.
Hedging Cost
This is the aggregate cost of hedging the portfolio. Here, it is $2,595, or 0.52% of portfolio value when opening these positions (assuming, conservatively, that you bought all of the put options at the ask and sold the call options on TTD at the bid, i.e., you placed all the hedging trades at the worst ends of their respective spreads.).
The Best-Case Scenario
The best-case scenario is the net potential return of 19.83%. That's what you'd get, net of the hedging costs if each security hit its potential return, which is unlikely.
A More Likely Scenario
Each time the site estimates a potential return for a security, it tracks how that security actually performed six months later and it continually updates the ratio of actual returns to potential returns. The expected return of 7.46% takes that ratio into account, along with the hedging cost. The odds of hitting that number on the nose in a particular portfolio are slim, but over time, the actual returns on average should approach the average expected returns.
Wrapping Up - How This Portfolio Differs
Each week in my Marketplace service, I present five portfolios to subscribers with dollar amounts ranging in size from $30,000 to $2,000,000. This portfolio differs from ones in my Marketplace service mainly in that I let my site pick all the securities for the portfolios in my service, unlike here where I foisted O upon it. Let's check back in a few months and see how this portfolio is doing.
How The Last Batch Of Hedged Portfolios Performed
To be transparent and accountable, I post the performance of all of the hedged portfolios I present in my Marketplace service. You can see the performance for the most recent cohort to finish here.