Leveraged Rewards vs. Leveraged Risks
Figure 1
(Readers familiar with our work may want to skip to the Comparing Details heading below.)
For those new to this analysis, here's how this works:
Market-makers [MMs] have the task of assembling enough sellers (or buyers) to balance the trade orders placed with them, big orders, typically for hundreds of thousands of shares at a time. And the time usually is right now - or the next 15 minutes, when the order dies. And at a specified price, not usually the most recent quote.
Tough job, but MMs are tough, experienced folks. They know which major institutional investors may have a potential interest in being on "the other side of the trade." Most often getting a "cross" where buyers and sellers are equal, won't happen. Then the MM may step in and take a position as a "principal", owning a long or short number of shares to bring the trade into balance between buyers and sellers.
But that typically doesn't happen unless the MM can strike an arbitrage deal in derivative securities markets - futures, options, swaps, etc. - that will insure the firm's capital involved in the stock trade against loss as market prices move.
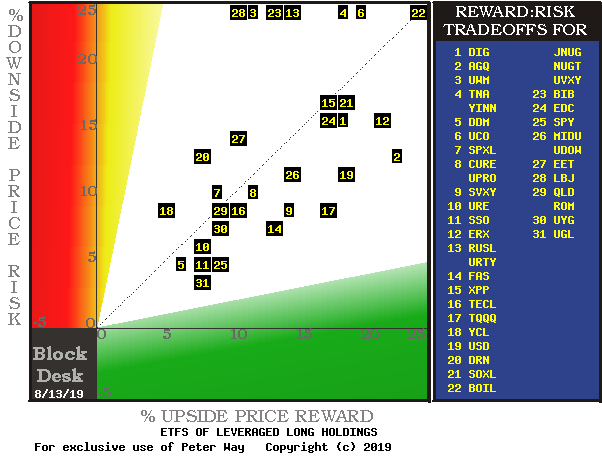
What that protection costs, and the way it is accomplished, tells just how far the professional MM markets believe the underlier stock's price can move. That's where the "forecast" co-ordinates used to locate the stocks in Figure 1 come from.
For example, UGL at location [31], NASDAQ:TQQQ at [17], and AGQ at [2] make up a "frontier" of attraction in the trade-off between upside and downside price-change prospects for leveraged-long ETFs. For market reference, there is also the unleveraged SPY ETF close by at location [25].
While TQQQ offers big price change opportunity, it does so at near -10% loss exposure, while UGL accepts half the price gain potential, but may be taking only one-third of TQQQ's exposure to the risk of capital loss. And then there is the potential for reward of half-again as much as TQQQ in AGQ, with nowhere near as much as a double of the risk.
But wait, there's more to examine
Figure 1 gives a set of single-point average best comparisons for the Leveraged Long ETFs, but life is more complicated by uncertainty, and the outlook for equity investments has its larger share of that involvement. Figures 2, 3 and 4 provide a number of such complications for comparison.
Figure 2
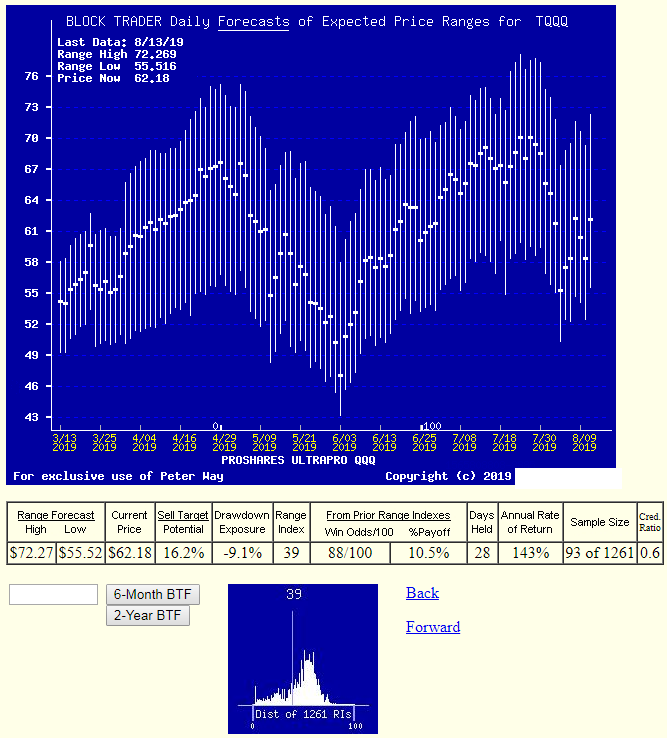
Every market day we compile history of price range forecasts for over 2,700 widely-held and actively-traded stocks and ETFs, as implied by MM hedging actions. In Figure 2 above the vertical lines span those price possibilities for TQQQ as they appeared in each market day of the past 6 months.
The heavy dot in each vertical is the closing market price of the stock on the day of the forecast. It splits the range for the day into upside and downside coming-price prospects.
A row of data between the two blue-background pictures details this day's explicit price range forecast and current close. The upside part of today's forecast is measured as percent price change between the current price and the high forecast (as a sell target) at +13.2%.
The downside is measured, not in price change terms, but as the proportion of the whole forecast range, here at 21%, referred to as the Range Index [RI]. This allows comparisons to be made between investment securities with widely varied uncertainty ranges (like perhaps at this point in time between MSFT and BA). It also provides the means within the analysis of just one security to identify prior times when upside to downside prospects had the same balance they have now.
It turns out that in the past 5 years (1261 market days) MSFT has had 93 prior days with a RI of 39. The "thumbnail" picture at the bottom of Figure 2 should make clear how frequently a 39 RI has occurred.
The RI frequency distribution also shows how orderly is the variations in balance of direction of price movement for TQQQ, and the present RI location suggests that coming movements are more likely to be up from here than down.
Other items in the data row tell what has happened to TQQQ price subsequent to when those prior RI 39s were seen. To standardize and make those experiences comparable across both time and among investment alternatives, we follow an unchanging portfolio management discipline called TERMD. It is the Time-Efficient Risk-Management Discipline.
Investment positions held under TERMD are sold when their price first reaches its sell target, or by no later than 3 months after its initiation by a MM forecast, regardless of gain or loss. Sold positions are reinvested the next day in then currently most-attractive equity alternatives.
In the data row the Win Odds tell what percentage of the number of instances in the RI Sample were closed out under TERMD at a price higher than their cost. The % Payoff is the average simple % gain or loss earned by all members of the RI sample, including loss experiences.
The days held are an average of market days experience of all sample members and it leads in a 252-day year to the annual rate calculation. Here 28 market days at 10.5% generate a 143% CAGR. A sample of 93 RIs out of 1261 is ample, statistically, and an average holding period of only 28 market days (less than 6 weeks) is relatively brief. Together they provide a robust forecast.
Comparing details
Now that you have a sense of the outlook for TQQQ, here in Figure 3 are the comparable items for UGL.
Figure 3
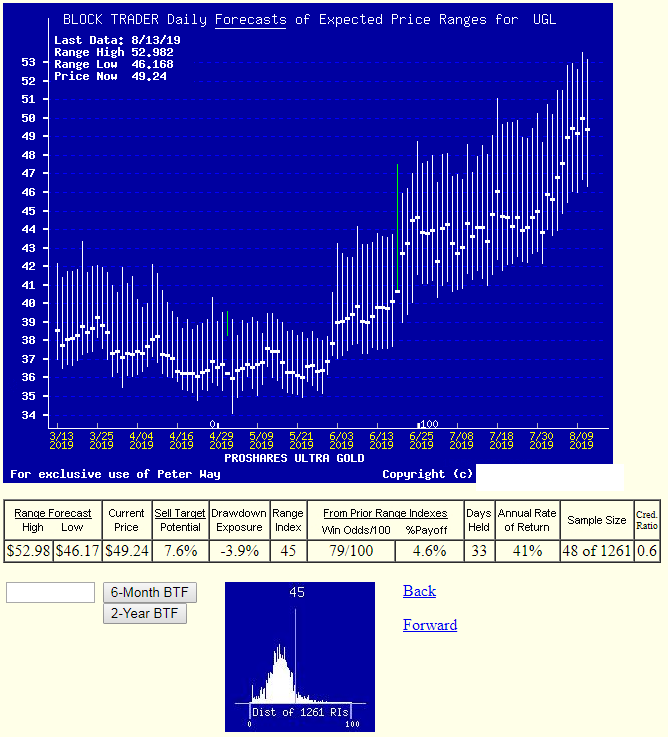
UGL's evident characteristic at present is an upward trend both in price and in price expectations. To the extent that price climbs faster than forecast, the RI will increase. At some point the downward influence will take over. The frequency distribution of RIs at the bottom of Figure 3 shows that for UGL a RI of 45 is an uncommon situation, and a change is brewing.
The comparables here in UGL are an upside Sell Target of +7.6 next to a +16.2% for TQQQ, a Win Odds of 79 in UGL and of 88 in TQQQ. A4.6% payoff at UGL compares with a +10.5% payoff for TQQQ. Even TQQQ's shorter holding periods of 28 market days than UGL's 33 helps TQQQ CAGR of +143% dominate UGL's prospect of +41% CAGR.
Let's see what AGQ has to offer with silver's outlook.
Figure 4
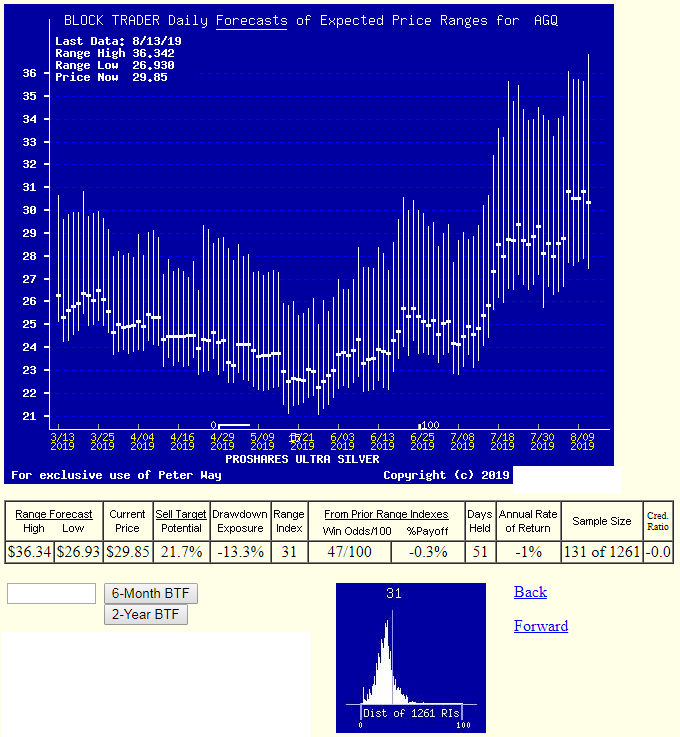
Here AGQ offers an expectation of above +21% price gain, but cannot marshal the history of subsequent actual % payoffs to support that assertion. Sellers of protection for AGQ shorts are willing to sell them insurance at prices which says the shorts should not need anything like a protection against a +20% coming price rise.
This may be because Silver has been in a declining trend for over two years and has not yet developed market conviction of a change in trend. A look at how weekly excerpts from the daily analysis have behaved may provide some useful perspective. See Figure 5.
Figure 5
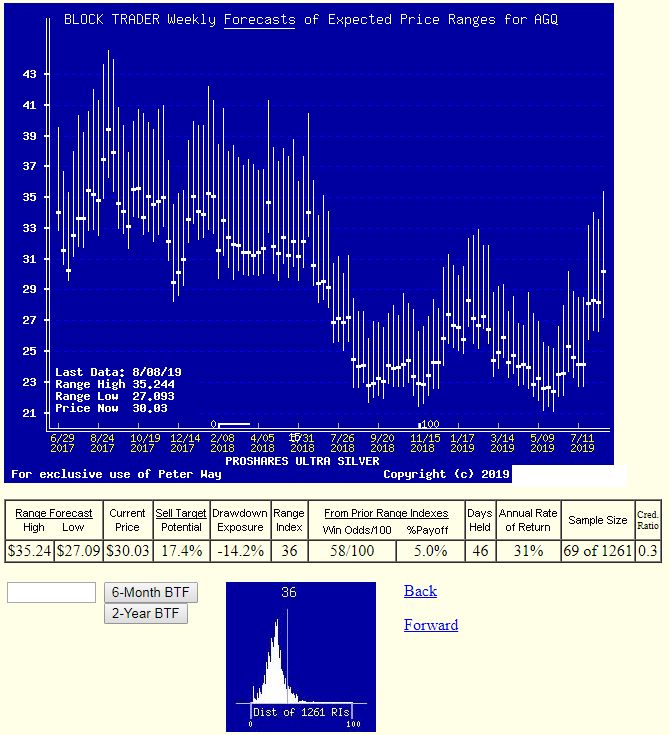
If AGQ is going to provide a rewarding alternative leveraged-long ETF to TQQQ, it will need some more elapsed time to develop evidence of its strength.
Conclusion
The best leveraged-long ETF speculation at this time appears to be in the big-payoff, good odds of TQQQ, where a CAGR history of 90+ examples of +143% in 28 days may make it worth being exposed to an interim temporary loss of -9% on the way to get the reward.