Much like Natural Gas, Crude Oil is an absolute pleasure to chart and trade. Its larger amplitude movements provide for not only wonderful percentage moves, but it also adheres nicely to Elliott Wave patterns and tends to respect Fibonacci levels such that we can almost always find opportunities to trade crude oil in both directions, up and down.
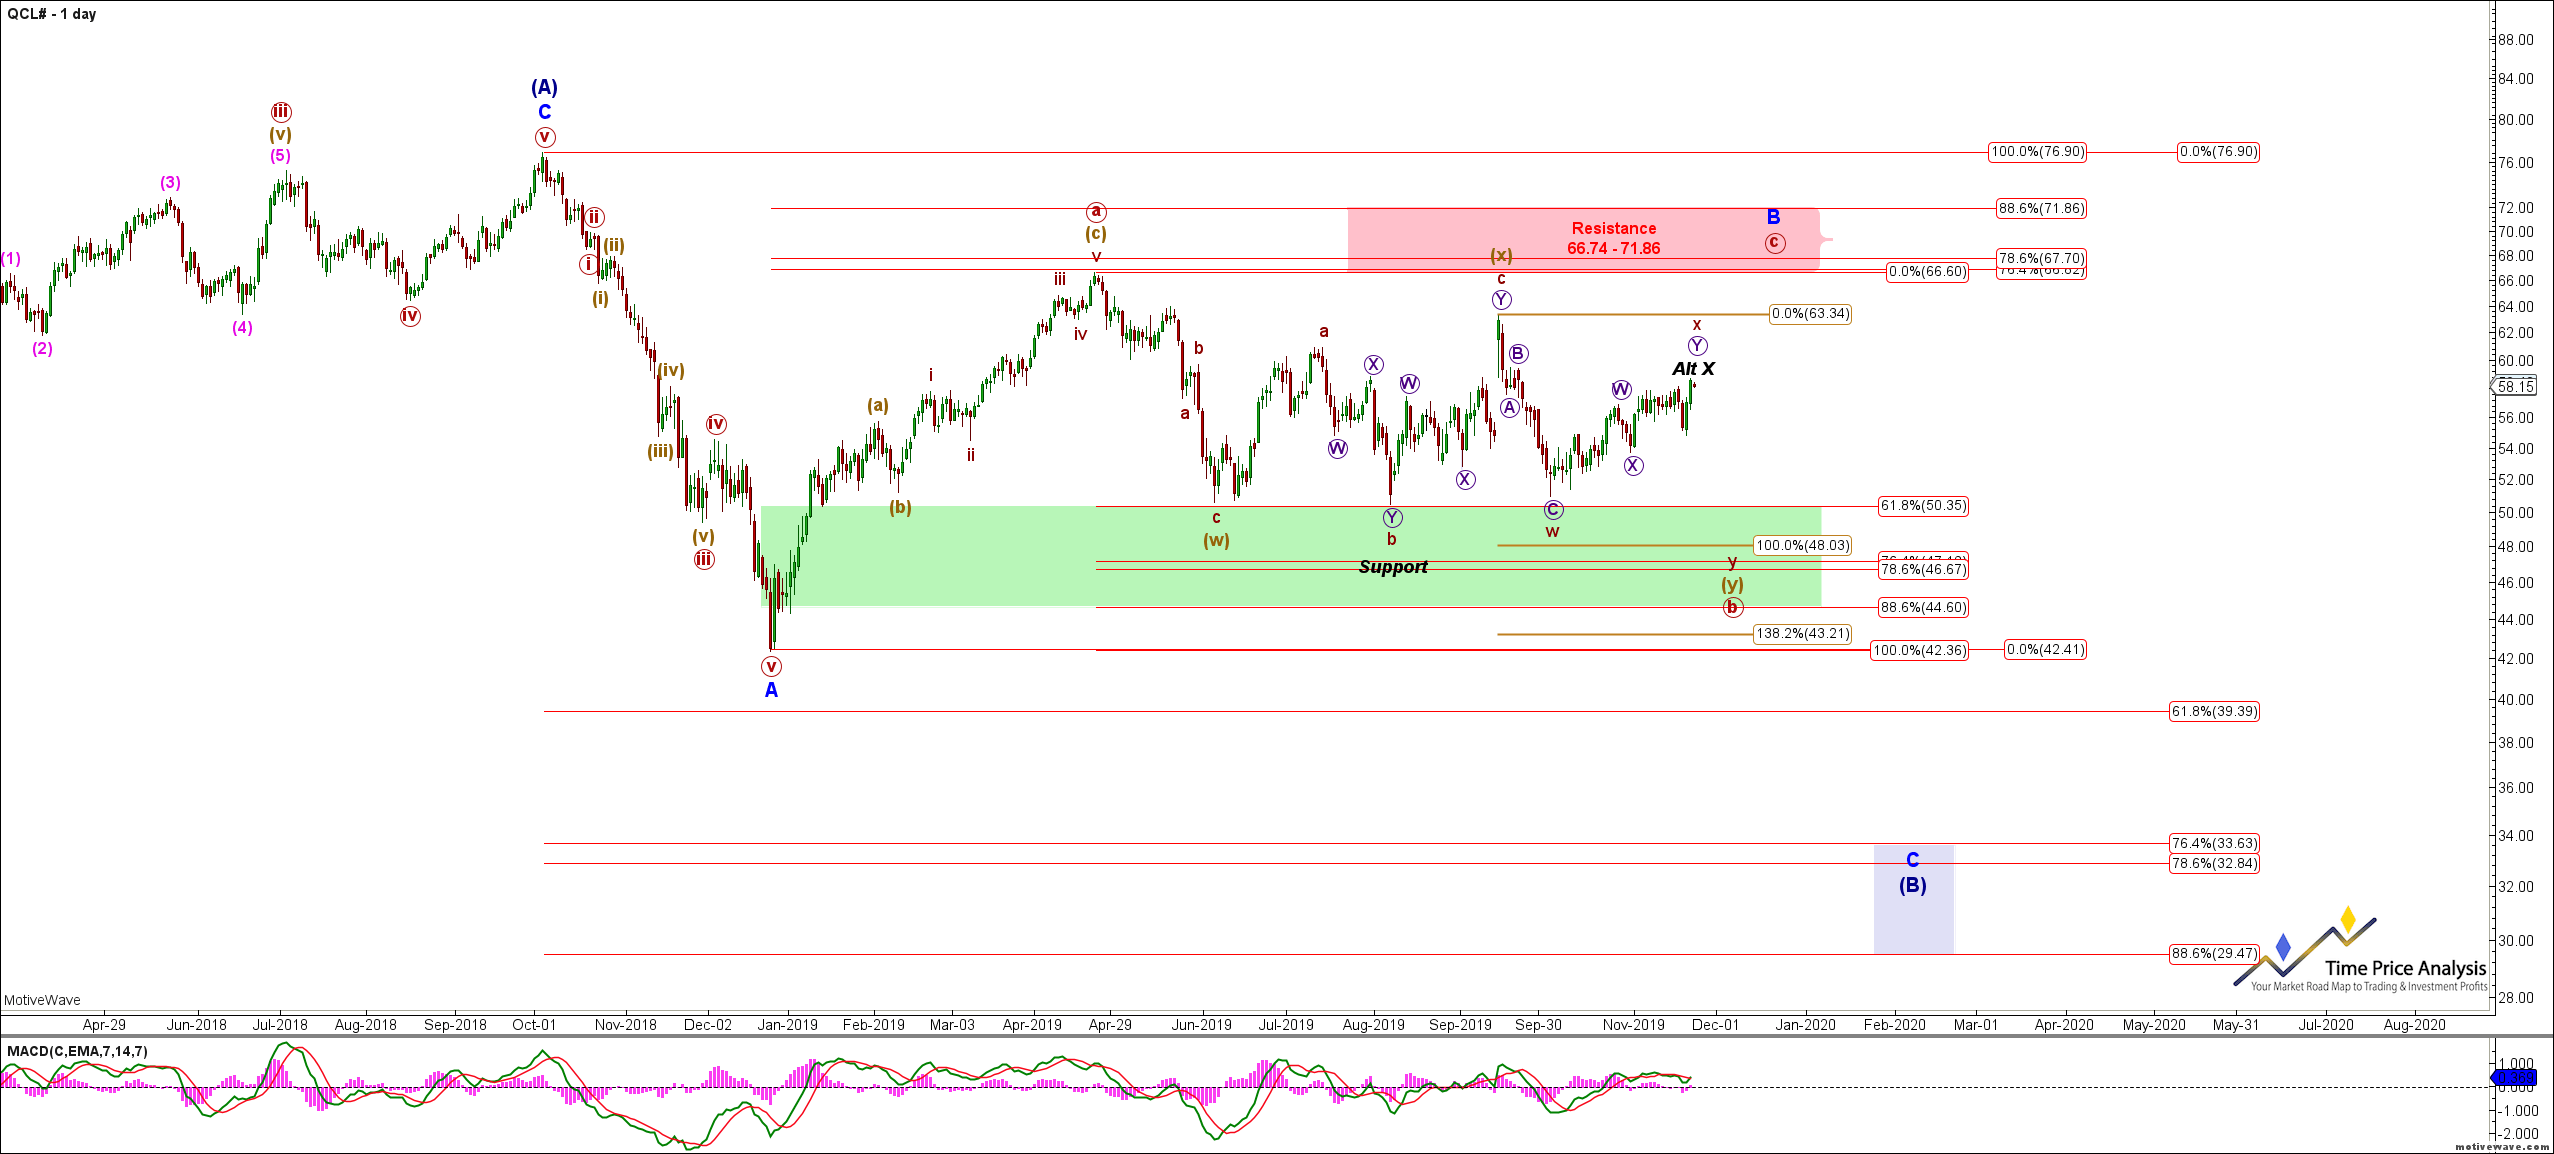
Crude is setting up for 4 larger moves over the coming few years. To better understand, the first 3 of these 4 larger moves review the Crude Oil Daily Chart below.
In this chart, note that Crude is in a complex B-wave that resides inside another even larger B-wave. B-waves are one of the two most variable Elliott Wave patterns, where they provide not only a lot of price action, but that price action can also be extreme with a range. Crude is moving into the 60 region that has been our target zone for some time now. Once this move up completes, which we suspect will be any moment now, we are expecting it to embark on a move down to the 48 region before blasting up to the 67-72 region, only to then drop again to the low 30s.
Crude Oil Daily Chart
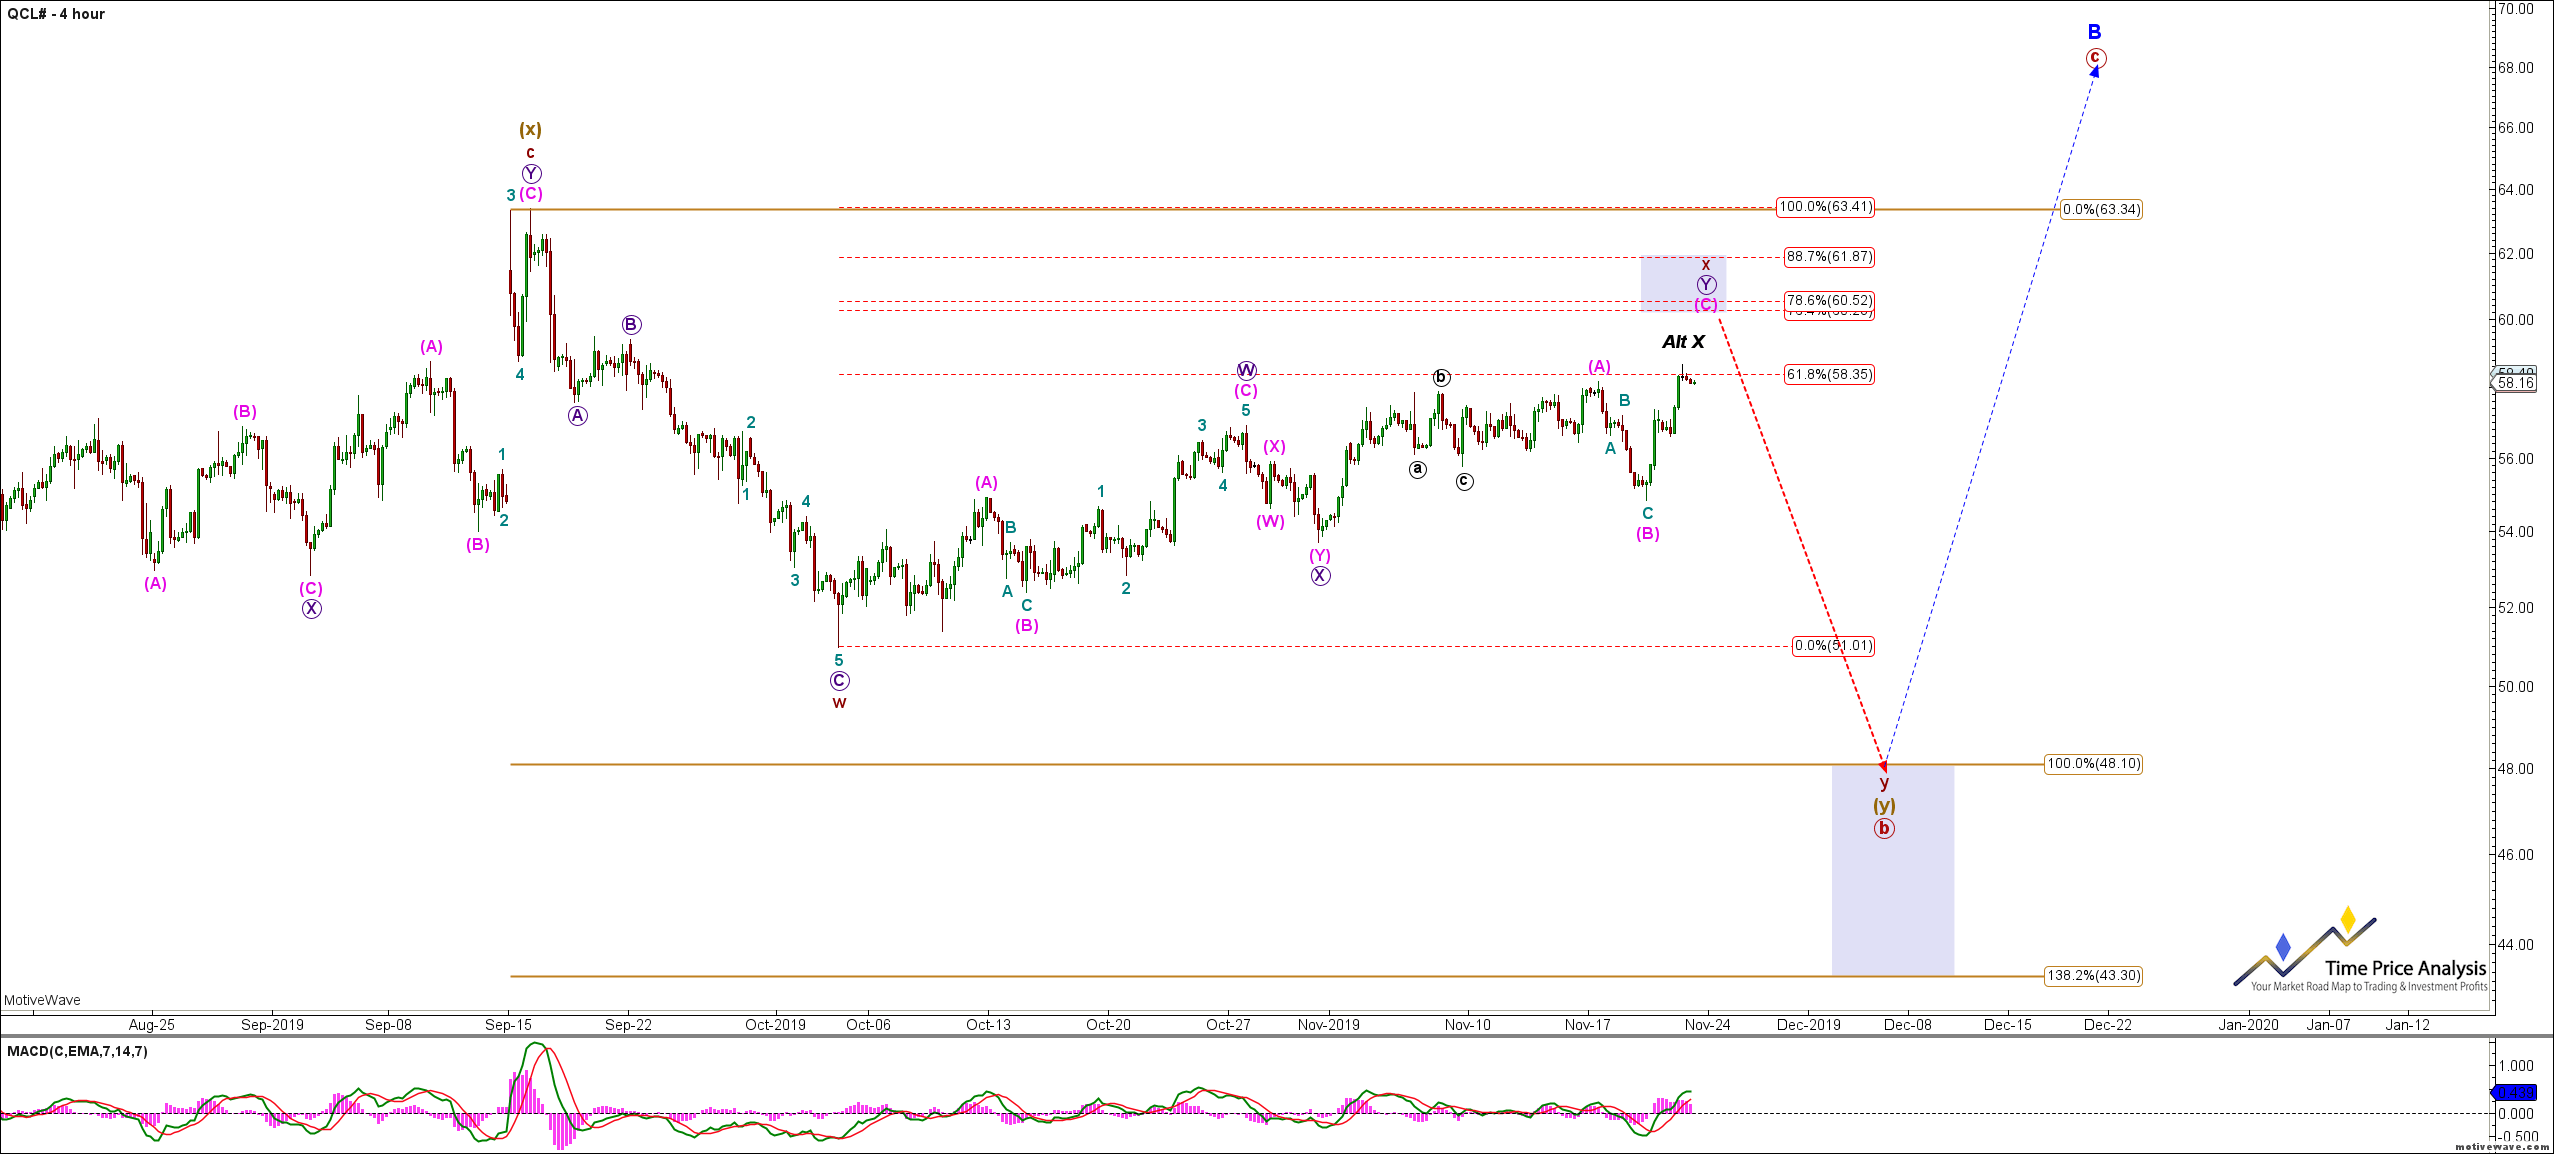
Drilling down, the next chart - Crude Oil 4-Hour Chart - shows the immediate opportunity for investors. Crude is topping in what we expect will be an X-wave of a larger WXY pattern that will make its way down to the 48 region. Herein lies the next trade opportunity for investors. To underscore, we are expecting a $12 move down, which represents a 20% move lower.
There are a number of ways for investors to capitalize on this move down in Crude Oil. For futures trades, obviously, the use of Crude Oil Futures is an option. For investors and commodity traders who use Exchange Traded Funds, there are countless inverse ETFs and leveraged ETFs. A few examples are ProShares UltraShort Bloomberg Crude Oil 2x leveraged ETF (SCO) or ProShares 3x leveraged inverse Crude (OILD). If these don't fit your fancy, then go to ETFdb.com and choose commodity, then crude from the screener, and research on your own to choose your inverse ETF of choice.
Now, let's drill down by looking at the Crude Oil Hourly Chart below. As noted above, crude is finishing the X-wave now, and once it is complete, crude will embark on a move to the $48 region. Note that there are a few areas where crude can top before resolving lower that range between its current high and up to as high as the $61.87 region. We are posting our analysis on a daily basis for our subscribers so that they can ensure putting on a position at the optimal time, or layering in.
Crude Oil 4-Hour Chart
Our own approach is to layer into a smaller position initially, and then once we can identify an impulsive move down, we will add to this position on the retrace of that initial move down. This enables us to use a finite stop out level and the prior high.
Commodities like crude oil and natural gas provide excellent trading opportunities. Insomuch, as general equities have heretofore not provided reasonable pullbacks to enter long and have continued to baffle shorts, commodities like crude oil, natural gas, and gold have provided investors many opportunities. We like to go where the money is, and in our business, the money is profits, and where crude oil is concerned, there are many profits to be made in the upcoming and larger directional moves.
Looking for detailed info on market opportunities; actionable entries and exits; Elliott Wave, Fibonacci, and Hurst Cycle counts? Check out my Marketplace Service, The Active Investor.
- Daily S&P, Gold, & Bitcoin analysis with easy to follow charts and videos.
- Weekly in-depth analysis S&P 500, Metals, Bitcoin, Crude, Natural Gas, and US Dollar.
- Active chat room
"Your charts are so clear, and so actionable, I really appreciate it."
"This service is top notch!"
"The analysis is so good and so clear that it keeps me in a SWAN mood."