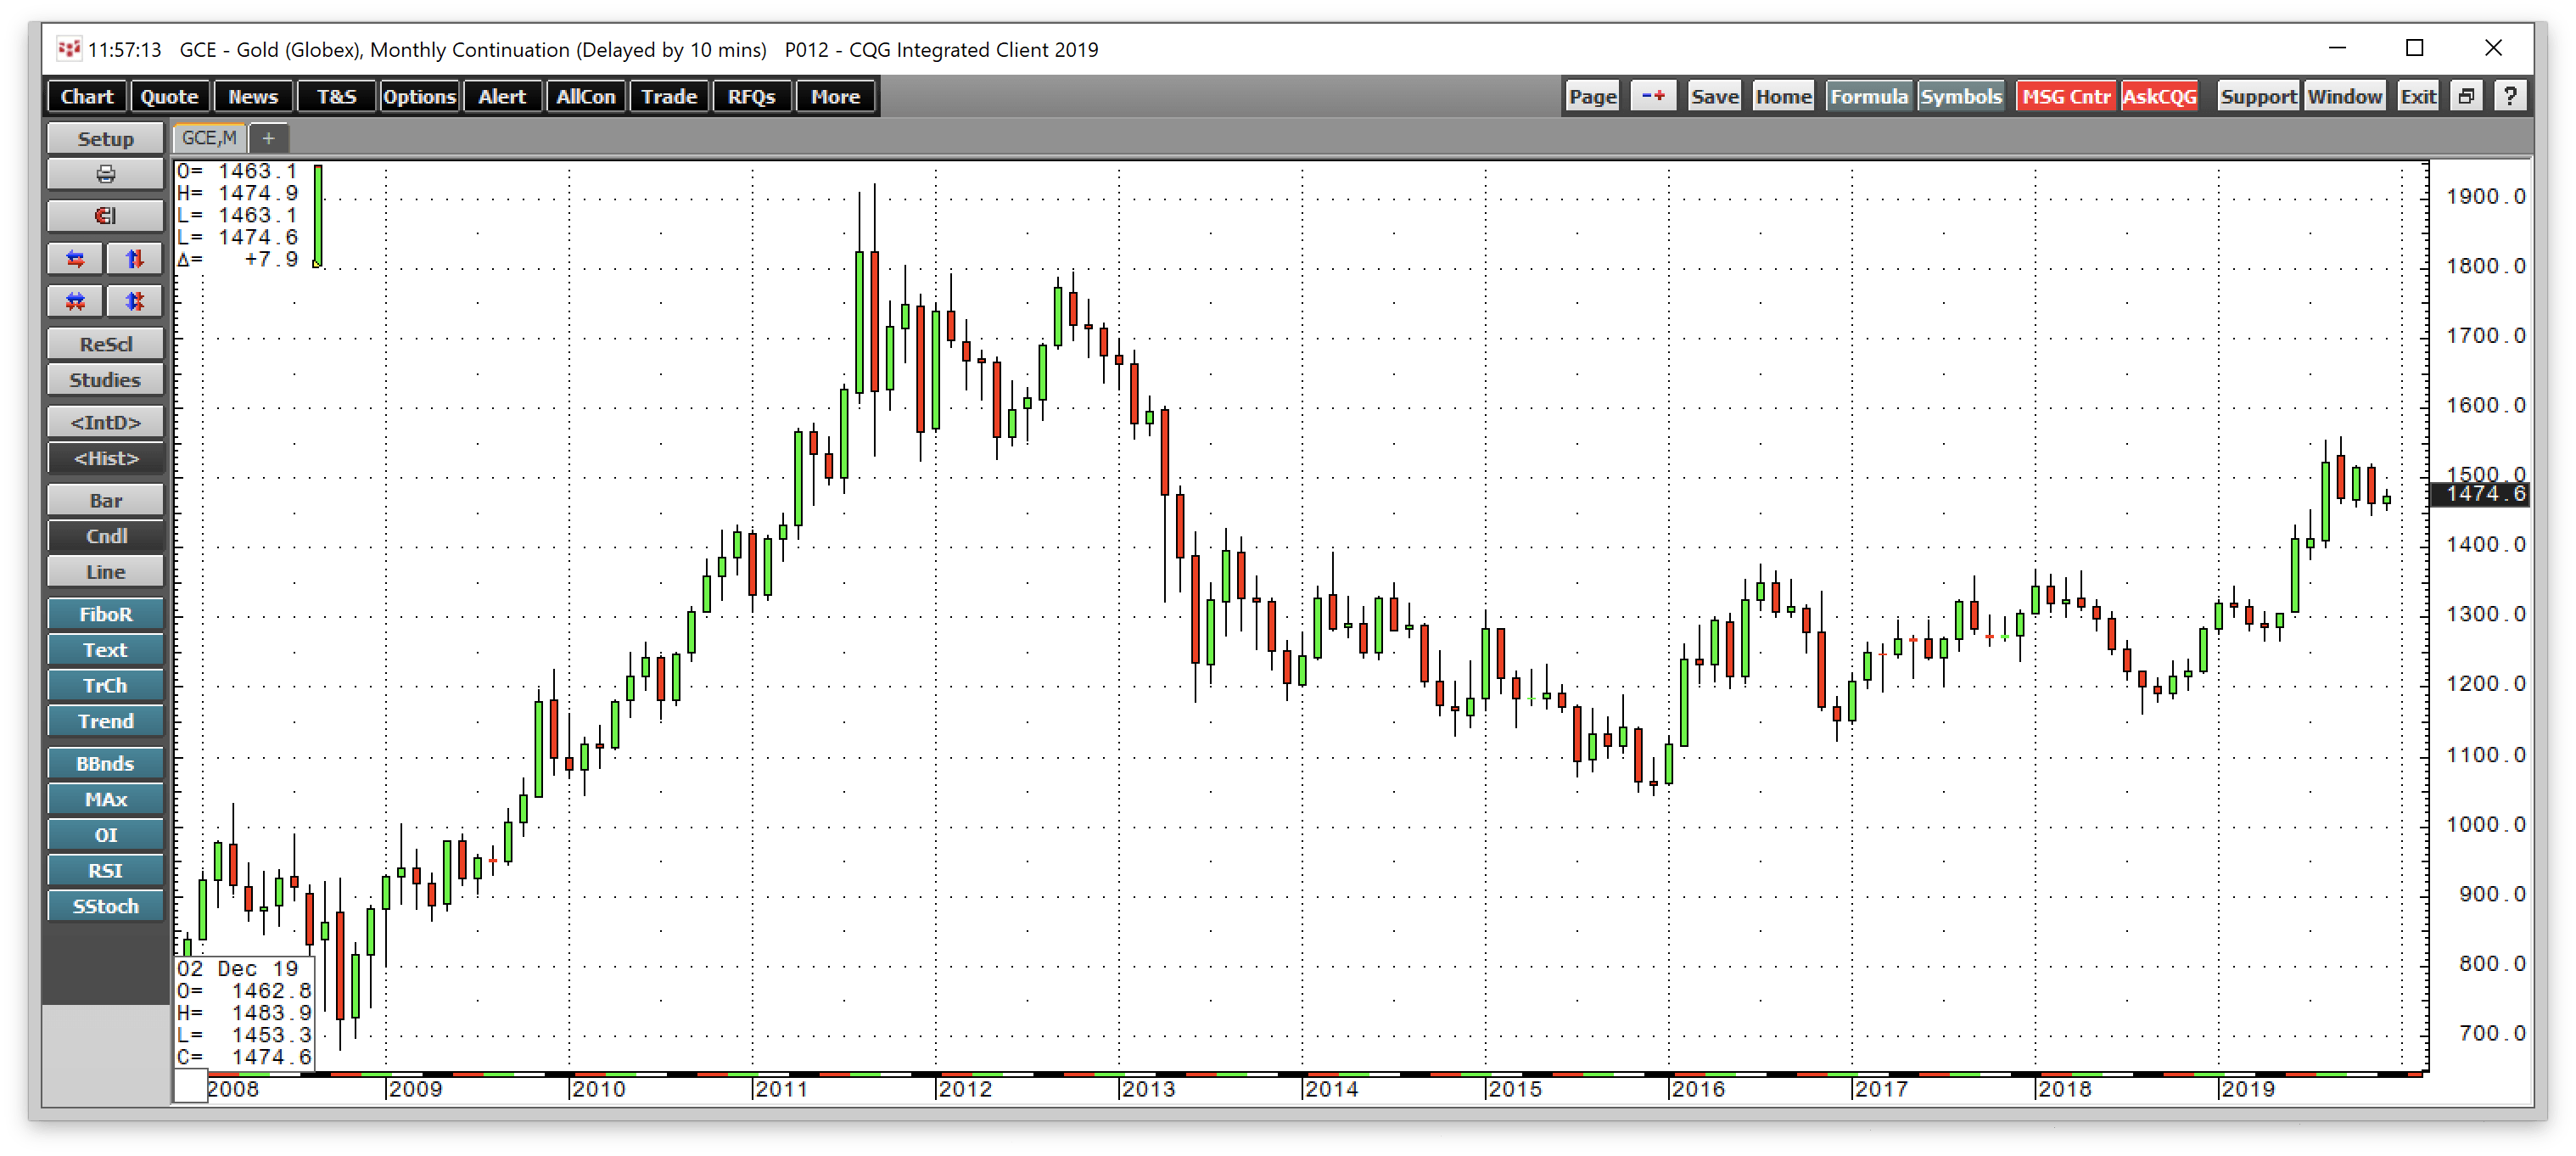
Last Friday, the price of gold was sitting around the $1479 per ounce level on the active month February futures contract on the COMEX division of the CME. Gold was a star-performer in 2019, and the price is on track to post a double-digit percentage gain on the year.
Gold took off on the upside in June when the US Fed told markets to expect lower interest rates by the end of 2019. The yellow metal surged above its level of critical technical resistance at the July 2016 high of $1377.50 per ounce. The Fed cut the short-term Fed Funds rate three times for a total of 75 basis points since July 31. The US central bank also ended its program of balance sheet normalization that had been pushing rates higher further out along the yield curve. At the same time, the central bank has been active in the repo market, providing liquidity and stimulus in the front end of the yield curve. Meanwhile, at the final meeting of the year last Wednesday, the central bank left rates unchanged and said that its current stance on monetary policy is "appropriate."
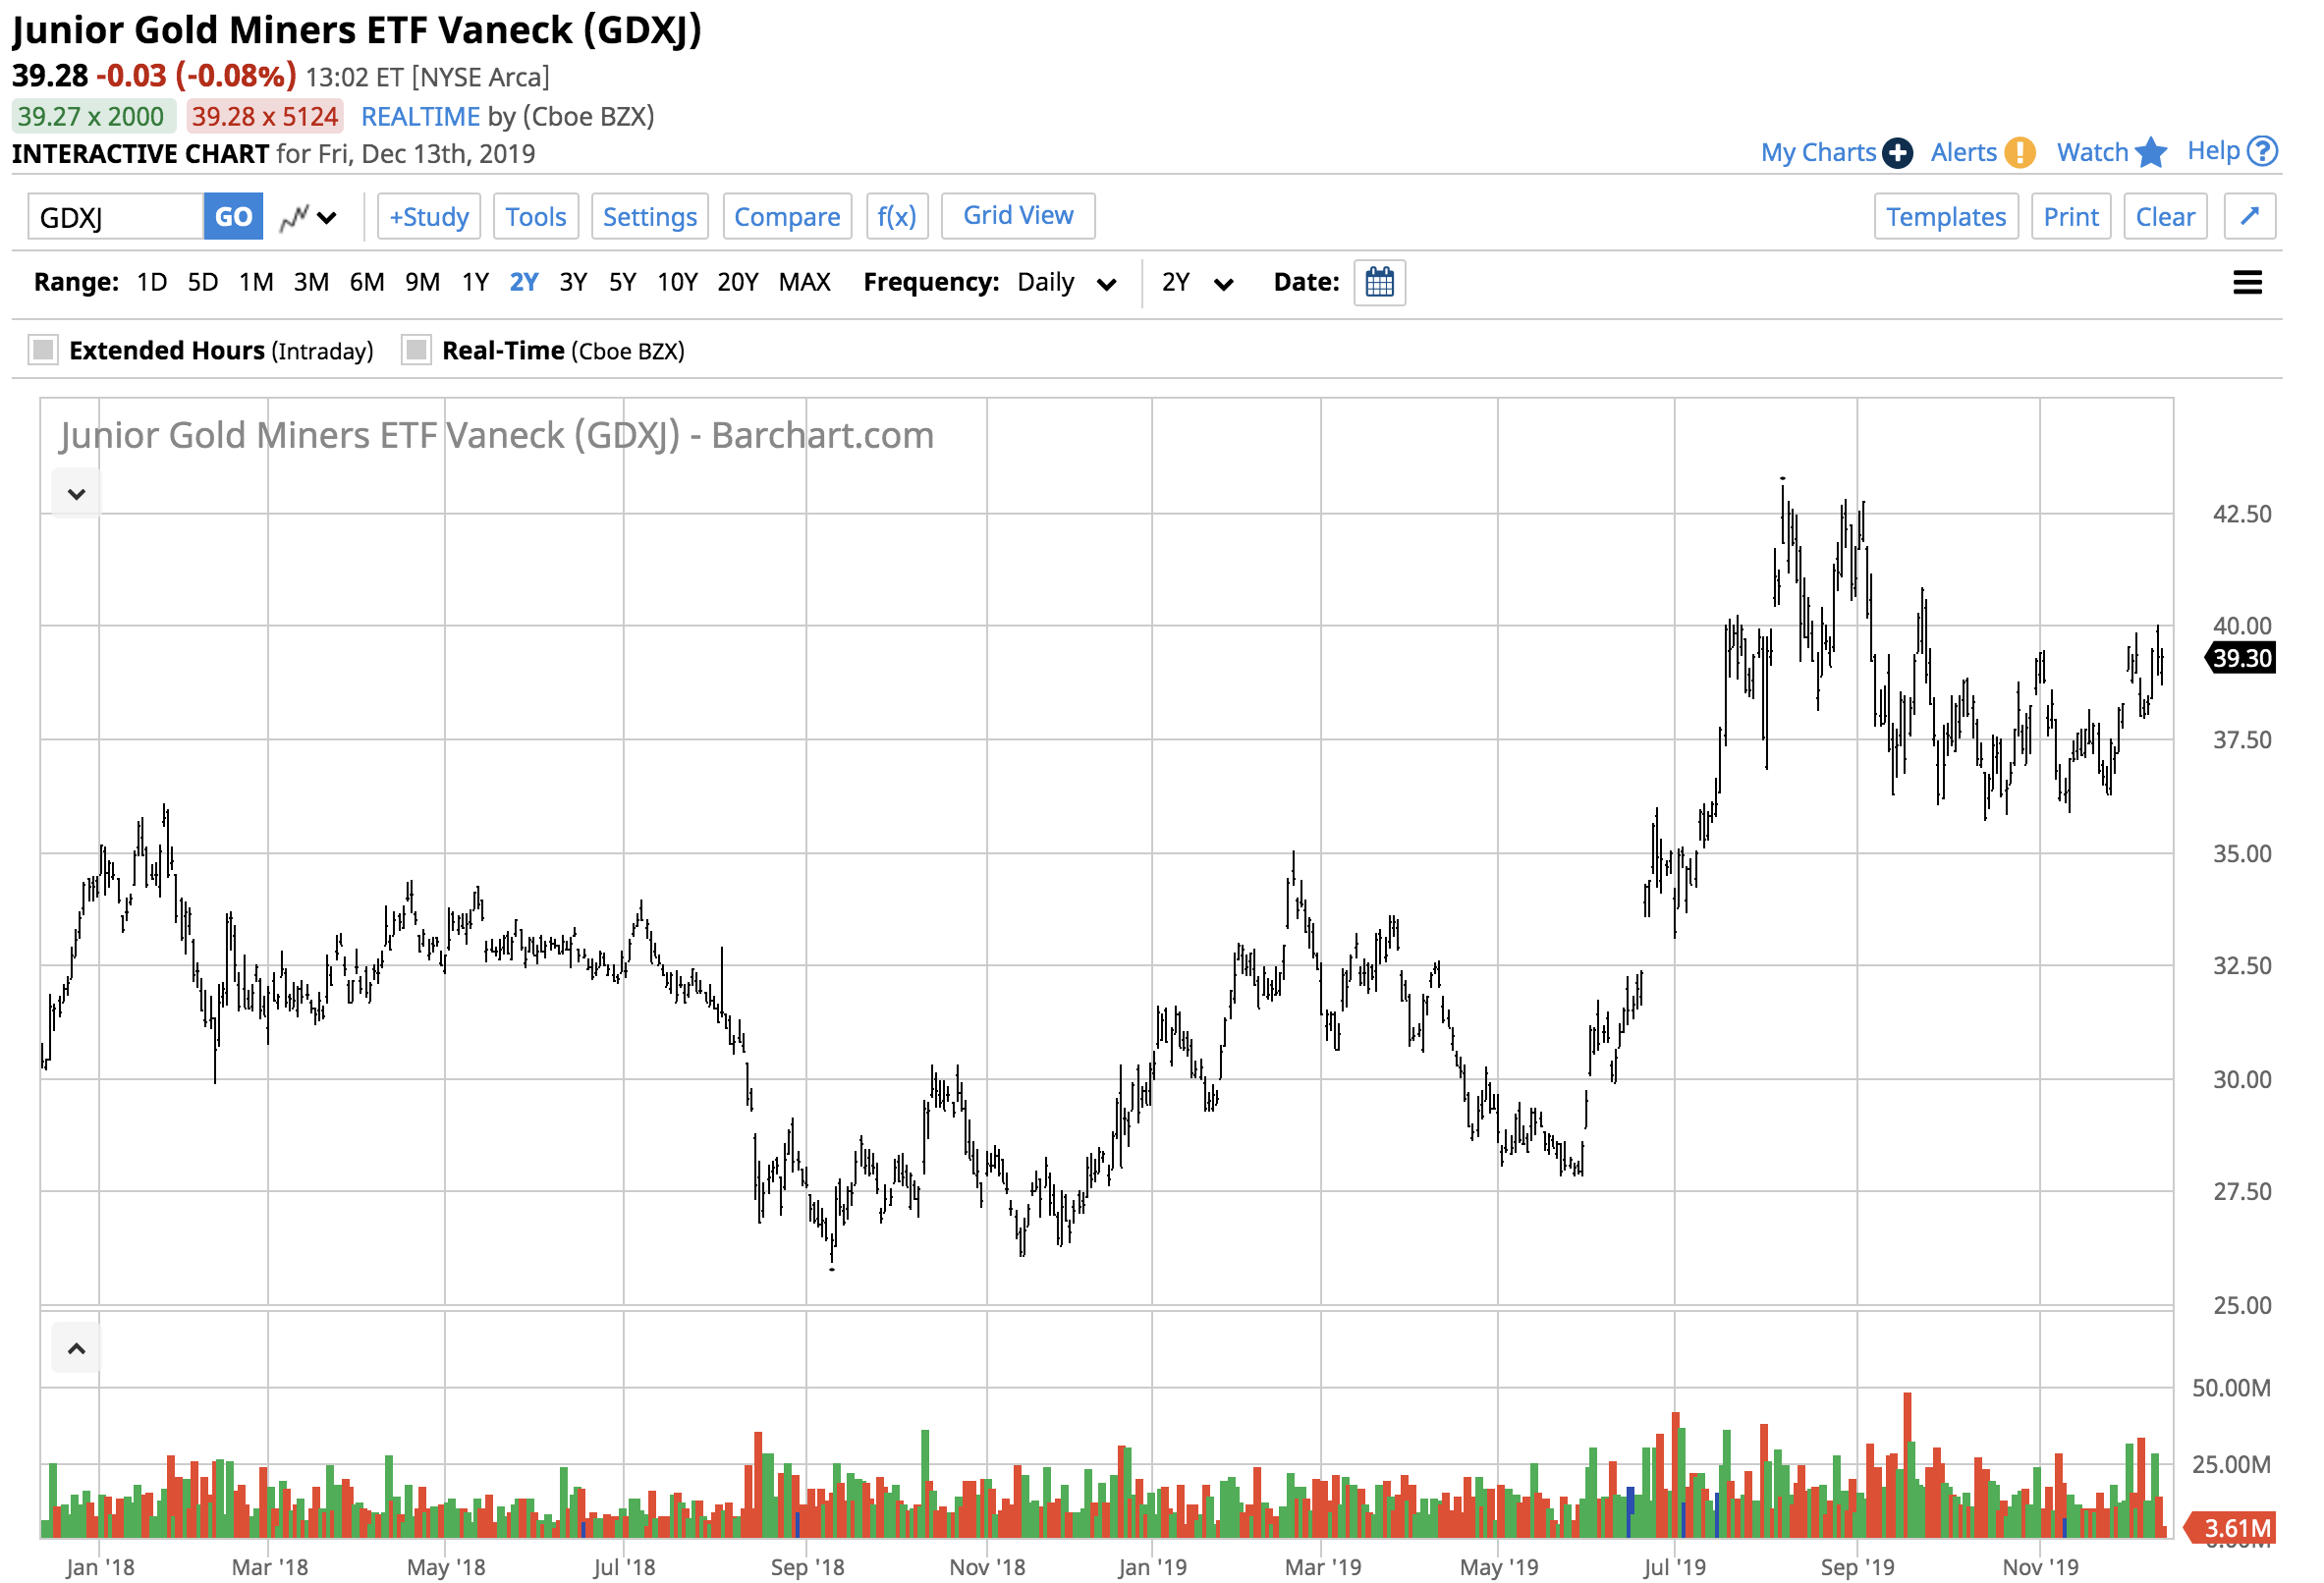
The trend in the US and global interest rates continue to be lower as we head into a new decade in a few short weeks. The current environment is favorable for the prospects for gold. At the end of the year, the price is sitting below the early September peak, but well above its level of critical technical support at just below $1380 per ounce. Gold continues to digest and consolidate the June through September rally. As we move into 2020, we could see buying return to the yellow metal. Gold mining shares often outperform the price of the precious metal on the upside. The junior gold mining shares tend to post a higher percentage gain than the leading companies in the sector during bull market periods in gold. The end of this year could be an excellent time to buy the VanEck Vectors Junior Gold Miners ETF product (NYSEARCA:GDXJ) on a scale-down basis.
Gold weakness at the end of the year, again
Price weakness at the end of the year is nothing new for the gold market.
Source: CQG
As the monthly chart highlights, gold fell to season lows at the end of the year in 2013, 2014, 2015, and 2016. Early in the year, gold recovered in 2014-2019. Therefore, the recent selling after a bullish year in the gold market should come as no surprise.
Sitting at the bottom of the trading range since mid-August
The gold market rose from a low of $1266 in April 2019 to a high of $1559.80 in early September.

Source: CQG
As the weekly chart illustrates, the gold market rose to its high in early September. The price action since then has taken the yellow metal to a low at $1446.20 in mid-November. Since then, gold has held the move recent low as it continues to digest the rally and consolidate. The continuous futures contract was trading closer to the November low than the September high at the end of last week.
Open interest, the total number of open long and short positions in the gold market, moved higher with the price since the April low. Rising open interest and increasing price tend to be a technical validation of a bullish trend in a futures market. The metric reached a new record high level at 719,211 contracts in November.
Oversold conditions at well above critical technical support
The weekly chart also shows that the corrective price action caused price momentum to fall into an oversold condition. When gold broke above the July 2016 post-Brexit referendum high at $1377.50 in June, the level of long-term technical resistance became support.
While the price of gold moved lower from the early September peak at almost $1560 per ounce, it has come nowhere near testing the breakout level. Gold has not traded below the $1440 level since it reached its peak and since the final week of July.
A period of price consolidation can be healthy for a futures market. When it comes to gold, it appears that each time the price dips towards the most recent low, buying appears. In 2019, central banks continued to be buyers of the yellow metal. And, gold-related ETF products have experienced high volumes as money continues to flow into the yellow metal.
While gold rose to its highest price since 2013 in September, in almost all currencies but US dollars and Swiss francs, the precious metal reached new record levels over the past months. The ascent of gold continues to be a commentary on the value of fiat currencies. Central banks hold gold as part of their foreign currency reserves. In retrospect, the price action in gold in 2019 was the continuation of a bull market that began around a decade and a half ago. As the price of gold rises, the value of world foreign exchange instruments against the yellow metal declines.
With gold sitting in oversold territory on the daily chart in mid-December, the market seems ripe for a recovery, and perhaps a move3 to higher highs, in early 2020.
January tends to be good for gold
All of the factors that lit a bullish fuse under the gold market in 2019 remain in place as we head into 2020. Global interest rates remain at historically low levels. While the Fed left rates unchanged at the FOMC meeting last week, the US central bank is unlikely to increase short-term rates in 2020. The Fed is an apolitical body. As 2020 is an election year, the US central bank would not want to make any monetary policy moves that could impact the election.
Additionally, global rates are historically low. The ECB lowered its deposit rate to negative fifty basis points in September and restarted its QE program in November. Low rates tend to be a bullish factor when it comes to the price of gold.
The US election will be a highly contentious affair in 2020, which could lead to periods of fear and uncertainty in markets across all asset classes. The potential for a significant shift in US policy under the opposition party could support a higher gold price. Before the final campaigns get underway, the President faces impeachment by the House of Representatives and a trial before the Senate.
At the same time, protectionist policies have increased volatility in markets. The ups and downs of the trade war between the US and China should continue into 2020. President Trump recently added a new front on the trade war after slapping tariffs on aluminum and steel exports from Brazil and Argentina. North Korea began test-firing missiles again, and Iran remains a clear and present danger in the Middle East. The "phase one" trade deal between the US and China last Friday could ignite the Chinese economy and the demand for gold in the Asian nation in 2020.
The bottom line is that the stage is set for another leg to the upside in the gold market that historically tends to start the year on a bullish note.
Junior gold mining stocks on a scale-down basis for the rest of 2019
So long as the price of gold remains above its technical support level at $1377.50, the next leg of the bull market that began in June remains firmly intact. At the $1479 level on active month, February futures at the end of last week could look like a bargain in 2020.
When gold rallies, the shares in the companies that extract the yellow metal from the crust of the earth tend to outperform the price action in the gold futures market on a percentage basis. Junior gold mining shares that are more speculative tend to do even better. Selecting a specific junior gold mining stock can be a challenge as idiosyncratic factors such as management, the location of mining properties, and government policies at production locations can impact share prices. Therefore, I prefer a portfolio approach when it comes to junior gold miners. The top holdings of the diversified VanEck Vectors Junior Gold Miners ETF product includes:

Source: Yahoo Finance
GDXJ has net assets of $4.85 billion and trades an average of over 15.7 million shares each day, making it a highly liquid product. The ETF charges an expense ratio of 0.54%.
The price of gold rallied from $1266 in April to a high at $1,559.80 or 23.2%.
Source: Yahoo Finance
The rally that took gold higher caused shares of GDXJ to rise from $27.80 to $43.10 or 55%. GDXJ provided a leveraged return of over twice the percentage gain in the gold futures market.
Gold was sitting a lot closer to its recent low than its September high at the end of last week. As we prepare for the new decades, GDXJ could be an excellent tool for those looking to load up on the yellow metal as it consolidates during the seasonally weak period of the year.
The Hecht Commodity Report is one of the most comprehensive commodities reports available today from the #2 ranked author in both commodities and precious metals. My weekly report covers the market movements of 20 different commodities and provides bullish, bearish and neutral calls; directional trading recommendations, and actionable ideas for traders. I just reworked the report to make it very actionable!
I am offering a 20% discount for an annual subscription to my service, The Hecht Commodity Report, through December 2019. With the holiday spirit in mind, I am offering a free trial to the service. You can sign up via this link.