In 2019, the Dow Jones Industrial Average (NYSEARCA:DIA) produced a strong 25.3% total return. Of the 30 constituents, 27 produced positive total returns. The tech heavyweights in this old Industrial gauge were the big winners on the year.
 The table below presents a more detailed look at performance with the 30 constituents in the index at the end of the year listed in descending order by their 2019 performance in the far right column. I have also used conditional formatting to highlight the differences in relative weights and market capitalizations.
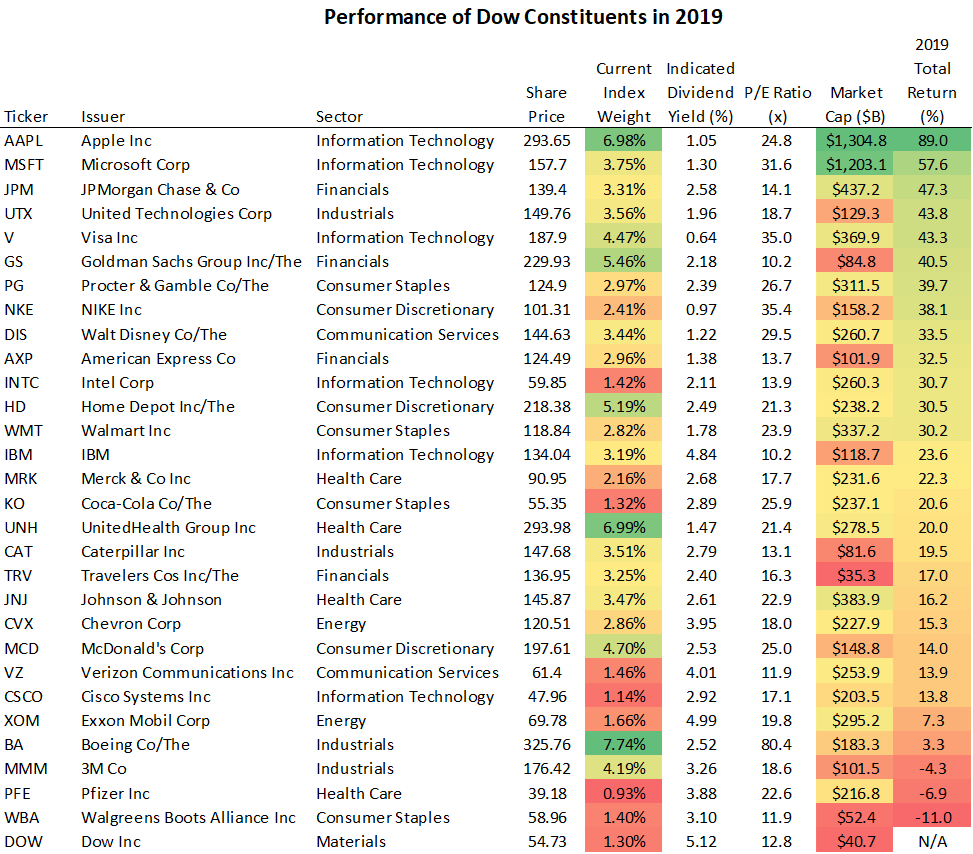 One of the earliest takeaways should be that the two best performing constituents - Apple (AAPL) and Microsoft (MSFT) - are by far the largest companies by market capitalization. Together, these two constituents account for 30% of the combined market capitalization of this list, but account for just over 10% of the index weight.
Why is that? The Dow got its start in 1896 as a means for synthesizing the movements of industrial stocks into a single number. The index uses weights based on share price. Microsoft, which has a roughly $1.2 trillion market cap, has 7.6 billion shares outstanding. It could just as easily have 3.8 billion shares outstanding, its price would be $314 instead of $157, and its weight in the index would have been 7.5% instead of 3.75%. Given that it was one of the best performers in the index, a higher weight would have increased returns on the index. Microsoft would be worth the same, its capitalization would just be subdivided differently. If the Dow Jones Industrial Average had used each constituent's beginning of year market capitalizations, the total return would have been a whopping 39% instead of 25%. That theoretical return would have been the highest since 1975 for the Dow.
While its adjusted price-weighting