All U.S. domiciled open-end funds (including both mutual funds and ETFs) took in $754.9 billion in net new money during 2019. This was the second largest annual net positive flow for funds since Lipper began tracking fund flows data in 1992, trailing only the $1.07 trillion intake in 2007. The net inflows in each of these years were driven by money market funds, as the asset group took in $720.4 billion (its largest ever) in 2007 and $537.4 billion (third largest ever) in 2019. Also contributing to this year’s net inflows were taxable bond funds (+$304.0 billion) and municipal debt funds (+$94.0 billion), while equity funds had $180.6 billion leave their coffers.
The net positive flows for taxable bond funds represented the asset group’s second largest in history, trailing only the $384.3 billion in 2009. A handful of taxable bond fund peer groups experienced banner years from a fund flows perspective, including Core Bond Funds (+$110.9 billion), Ultra Short Obligation Funds (+$33.1 billion), Core Plus Bond Funds (+$32.2 billion), and Multi-Sector Income Funds (+$28.9 billion). Drilling down to the fund level, we find that three passively managed Vanguard products turned in the most impressive individual net inflows for the year. These funds are Vanguard Total Bond Market Index Fund, Vanguard Total Bond Market II Index Fund, and Vanguard Total International Bond Index Fund, which took in $26.8 billion, $23.5 billion, and $23.2 billion, respectively.
The net intake of $94.0 billion for muni debt funds was the best ever for the asset group, outdistancing the net positive flows of $81.1 billion in 2009. The national muni peer groups dominated the net inflows while accounting for $79.6 billion of the net new money. Among the national muni peer groups, General Muni Debt Funds (+$30.4 billion), Intermediate Muni Debt Funds (+$23.0 billion), and High Yield Muni Debt Funds (+$19.2 billion) contributed the most. At the fund level, the largest net inflows belonged to Vanguard Intermediate-Term Tax-Exempt Fund (+$9.6 billion), Goldman Sachs Dynamic Municipal Income Fund (+$4.2 billion), and Nuveen High Yield Municipal Bond Fund (+$4.2 billion)
The net outflows for equity funds (-$180.6 billion) were the group’s worst ever, surpassing the $112.9 billion pulled from equities in 2016. Domestic equity funds, which are funds that invest at least 75% of their assets in U.S. stocks, accounted for the lion’s share of net outflows (-$150.3 billion), while nondomestic equity funds had $30.3 billion leave their coffers. This was the fifth straight annual net outflow for domestic equity funds and its worst ever, while for nondomestic equity funds it was the second worst annual net outflow on record behind only the $72.0 billion lost in 2008. The hardest hit among the peer groups included Multi-Cap Value Funds (-$27.3 billion), Large-Cap Growth Funds (-$22.6 billion), Multi-Cap Growth Funds (-$22.5 billion), and International Multi-Cap Value Funds (-$12.5 billion).
U.S. Domiciled Open-End Funds (including both mutual funds and ETFs), Annual Net Flows ($Bil), 2015 –2019
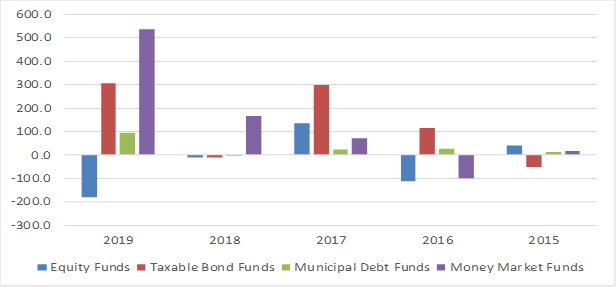
Source: Lipper from Refinitiv