The Vanguard Extended Duration Treasury Bond ETF (NYSEARCA:EDV) invests in ultra-long-term Treasury Bonds, usually with a 25+ year maturation. Because of this, it has very high volatility but is usually negatively correlated with the stock market, creating a historically great risk-hedge opportunity for investors. That said, the negative relationship does not always hold and investors may find that it fails precisely when they need it the most.
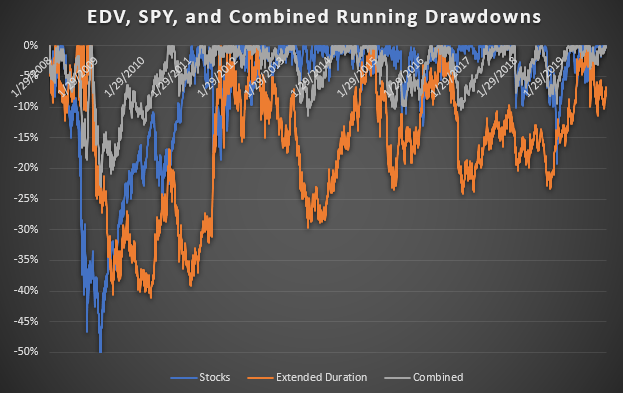
Both EDV and the popular S&P 500 ETF (SPY) have delivered nearly the same returns since January 2008, but the '50-50' combined portfolio has experienced very little drawdowns compared to both:

(Data Source - Yahoo Finance)
As interest in risk-hedging and portfolio optimization has grown, this has made such a hedging strategy very popular. This portfolio has delivered consistent returns with minimal drawdowns.
See below:
(Data Source - Yahoo Finance)
As you can see, in itself EDV experiences more volatility than the S&P 500, but volatility collapses when combined with the stock market fund. That said, the lower interest rates are, the higher is EDV's volatility and the lower its future returns. Even more, if inflation continues to rise, then it could quickly unhinge the "hedging" value of both due to the 'valuation effect'.
EDV Returns and Inflation
The number one risk to EDV is inflation since its bonds are ultra-long term in structure. Inflation has been falling over the past few years (and decades), so investors may not realize just how large this risk is.
To illustrate, take a look at the correlation between EDV's dividend yield and the implied inflation rate:
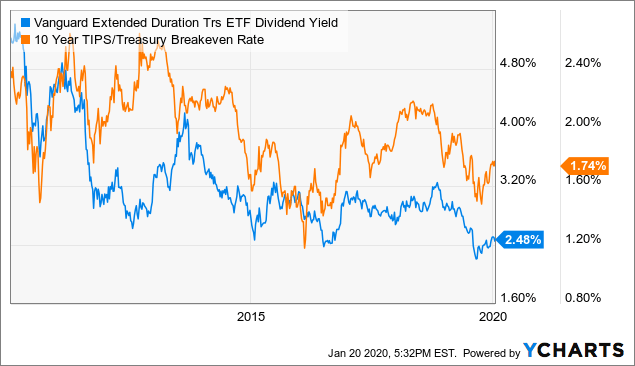 Data by YCharts
As you can see, the two are highly correlated. When inflation expectations rise, EDV's price falls such that its dividend yield accounts for inflation. Today's implied inflation rate and EDV's dividend yield are extremely low, but it seems they will both rise soon.
Take a look at the recent rise in wage inflation and core CPI inflation:
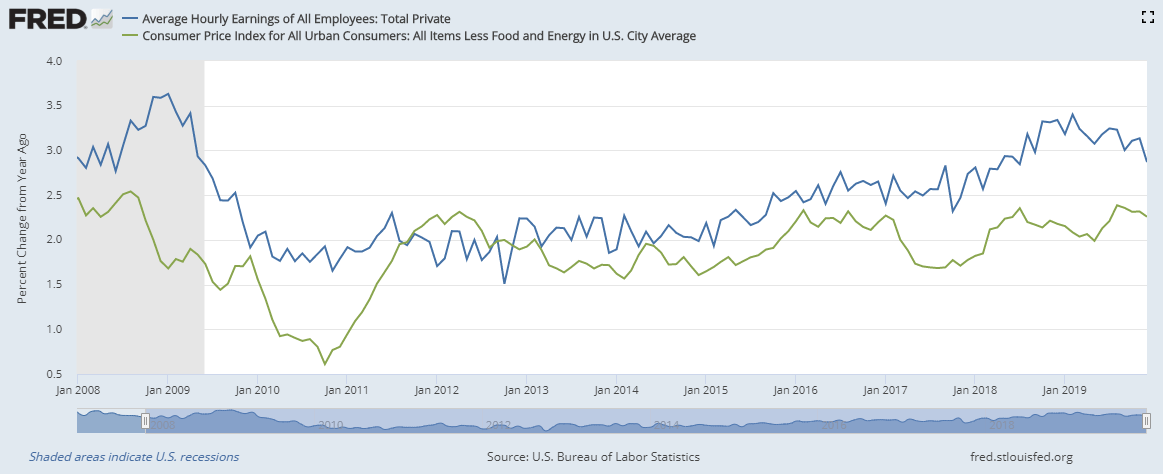
These two figures tend to be the primary long-term drivers of the inflation rate. They were rising steadily until last year and have since mellowed out following the decline in economic growth last year. That said, the long-term trend still seems to be positive which may imply another inflationary super-cycle is on the horizon. With interest rates this low for this long and money creation being as high as it is, it is hard to see how inflation will remain low in the 2020s.
Using the current implied inflation rate, EDV's 2.4% yield-to-maturity, and its effective maturity of 25 years we can actually calculate the ETF's implied price given a rise in inflation. The results highlight how dangerous the ETF can be:
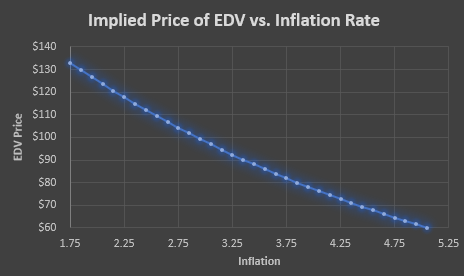
(Self Sourced)
As you can see, a 1% rise in inflation would cause EDV to lose about 25% of its value, a 2% rise 40%, and a 3% rise about half. Of course, most investors likely believe that inflation will never rise back to 5% again or else they would not dare to own the ETF. That said, long-term data suggest that such an occurrence is likely this decade.
A 120 Year Lookback on '60/40'
Unfortunately, the 25+ year Treasury bond is not very old so we cannot backtest it too far. That said, the 10-year Treasury bond is as old as the United States Treasury and is highly correlated to the ultra-long-term bond. Since the 25+ year bond is more volatile than the 10-year, we can shift our "combined portfolio" from a 50-50 stock-bond portfolio to a 40-60 stock-bond portfolio and would likely have a similar result.
Using data from Multpl, I created a 120-year S&P 500 performance index (with dividends) as well as a 120-year 10-Year Treasury performance index. Here they are:
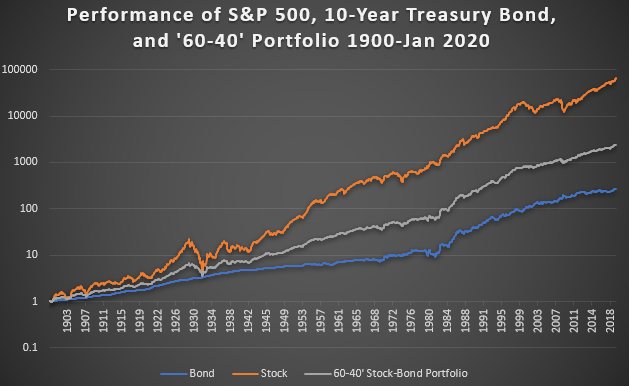
(Multpl/Self-sourced)
As you can see, stock performance has been much higher than bond performance but volatility has been higher in stocks. Even more, since the rise in deflation from 1980 onward, bond performance has been well-above its long-term logarithmic trend and has enhanced the returns of '60-40'.
Now, it is best if we adjusted the '60-40' portfolio for inflation in order to get the more valuable 'real return' figure. Interestingly (and logically), the 10-year Treasury yield is a great predictor of '60-40' combined portfolio real returns over the following decade. See below:
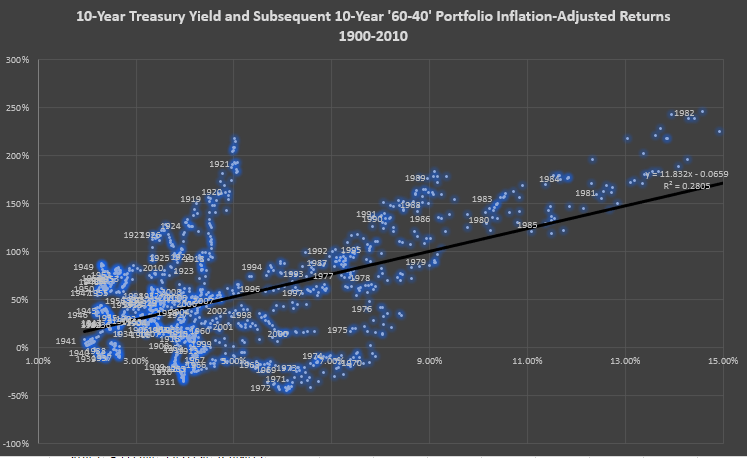
(Multpl/Self-sourced)
As you can see, there is a very strong correlation between higher yields and higher 10-year total returns. With the 10-year Treasury around an all-time low of 1.8% today, the historical relationship suggests '60-40' investors will only make a 15% real return over the entire next decade. This is logical considering the 10-year yield is so low as well as that of EDV, but it also means investors would be smart to do away with the 'stock-bond' portfolio concept.
Now, you may note that this relationship has failed to the upside over the past decade which is seen in the large spike around the 4% area of the X-axis largely induced by the 1920s (and 2010s) and a drop around the 6% zone during the 1970s.
I'd argue these reverberations can be tied to the money supply. Over the past decade, M1 Money Stock has risen from $1.4 Trillion to nearly $4 Trillion and, historically speaking, the creation of money supply and the real returns on the '60-40' portfolio have been highly correlated:
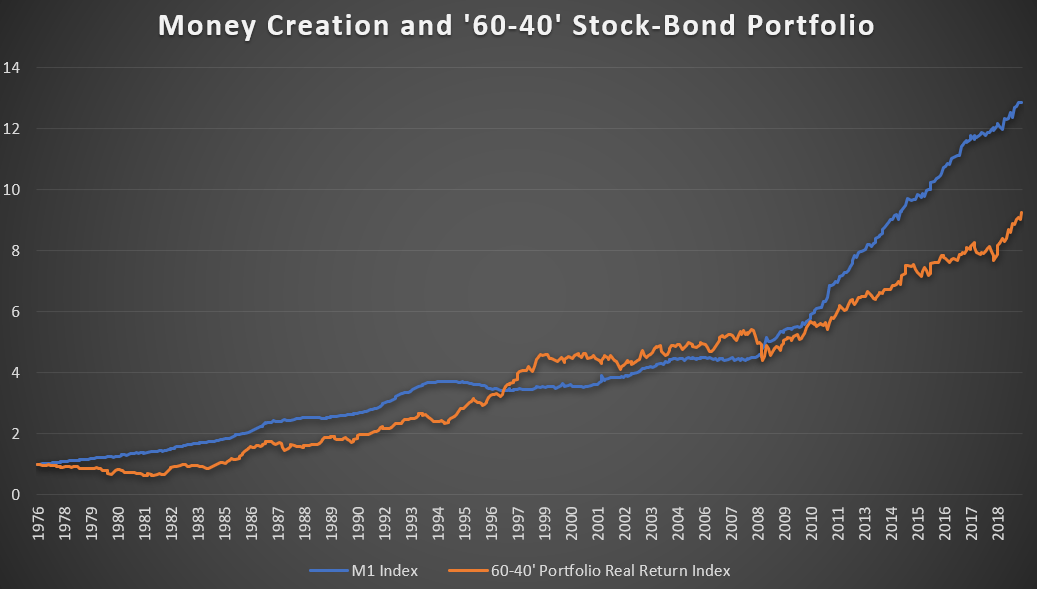
(Multpl/Self-sourced/Federal Reserve)
As you can see, periods of rising M1 usually correspond to rising inflation-adjusted returns of '60-40' and lulls in M1 (as was seen in the 2000s) correspond to poorer performance in '60-40'. This is logical considering the fact that new money tends to start its life in the bond market and then move to the stock market and finally into the goods & services market.
While M1 is increasing today due to the recent QE4, I have my doubts it will continue to do so for the next few years. If bond investments underperform, as is likely considering their abnormally low yields, the money supply will most likely fall with it. Second, if inflation continues to climb, the Fed will not be able to keep pursuing QE.
Based on historical data, this means that the 2020s may be a very difficult decade for '60-40' and it seems clear that Treasury bonds will be the biggest drag on investor portfolios.
The Bottom Line
While much of this discussion focused on the 10-year Treasury '60-40' combination, it is important to realize that the ultra-long-term EDV is essentially a leveraged version of the 10-year Treasury bond. Demand for these long-term bonds has been on the rise and the Treasury Department recently said that it would be selling new 20-year bonds this year, which could add even more pressure to EDV.
In my opinion (and based on historical precedent), the 'stock-bond' portfolio strategy is quickly dying. While it delivered stellar returns last year, the yield curve is flat and long-term yields are incredibly low. In fact, long-term yields have never been this low in their roughly 2400 year history. Logically, lower yields = lower returns but this comes not only through lower payments but also through principal losses from when rates pop back up after inflation rises high enough.
Due to this significant risk, investors would be smart to avoid EDV and most long-term bonds besides for speculative purposes. If you believe that inflation will dive again, EDV could have a nice short-term rally. However, energy prices and most forward indicators suggest higher inflation which could quickly bring EDV much lower. Overall, EDV is a sell and I do not believe it will be a long-term buy for years to come.