While (thanks to Bespoke) much of the Street and the financial media have picked up on the mega-cap concentration within the SP 500, with the top 5 names now being 17.3% of the SP 500's total market cap, per Bespoke's Sector Snapshot as of Thursday, January 16th, 2020.
What's more fascinating to me is the individual stocks weightings within the 11 sectors within the SP 500.
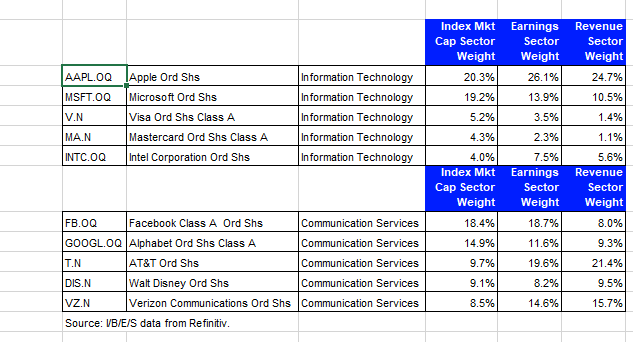
Looking at the top of the above table provided by IBES by Refinitiv, Apple (AAPL) and Microsoft (MSFT) are 40% of the Technology sector's market cap weight. Apple's EPS and revenue "weight" within the sector is a whopping 26% and 24% respectively.
Apple's EPS weight within the Tech sector is still larger by 25% than its market cap weight. (Dang…) And nothing is slowing down that market cap growth.
Microsoft, given its multiple, is a smaller, but still substantial 13.9% and 10.5% respectively.
Looking at the lower half of the table, the Communication Services sector - the truly surprising statistic was that AT&T (T), although a smaller market cap weight than Facebook (FB) and Google (GOOG) (GOOGL), sports a 19.6% EPS weight within Communication Services, and a 21.4% revenue weight.
Summary/Conclusion: This data is only pointed out to readers to highlight the difference between the market cap weights within a sector and the individual stock EPS and revenue weights. For sector ETF buyers, the market cap shifts or changes are what matter, but know what's behind the largest components.
Per the IBES data this morning (S&P 500 Earnings Scorecard), and remember the Communication Services sector was combined with Telco and Technology sectors a few years ago and then spun off into its own sector, the combined market caps of Tech and Communication Services as of last night are 34.4%, around where Technology peaked as a percentage of the S&P 500 market cap in March 2000.
A value judgment about the US stock market is not being made with that latest statement, since Apple remains far more reasonably valued than any of the major Tech components in March 2000.
This blog tracks the Top 10 market cap weights within the SP 500, and the last update in mid-December '19 noted that the Top 10 stocks were 23.6% of the S&P 500's market cap at that time.
Afraid to look now.
Thanks to IBES and Tajinder Dhillon for the data boost.
Editor's Note: The summary bullets for this article were chosen by Seeking Alpha editors.