ETF Overview
iShares Global Technology ETF (NYSEARCA:IXN) owns a portfolio of large-cap and giant-cap global technology stocks. The fund seeks to track the S&P Global 1200 Information Technology Index. Most of the stocks in IXN's portfolio have competitive positions with moats. In addition, most of these stocks have strong financial health ratings as well. Stocks in IXN's portfolio should benefit from several technological growth trends in the next few years. Therefore, we think this is a good holding for investors wanting some exposure to technology stocks outside of the U.S. Its shares may not be cheap, but given the fact that growth stocks are rarely very cheap, we think investors may want to start building a position and gradually add more shares if there is any fund price weakness.
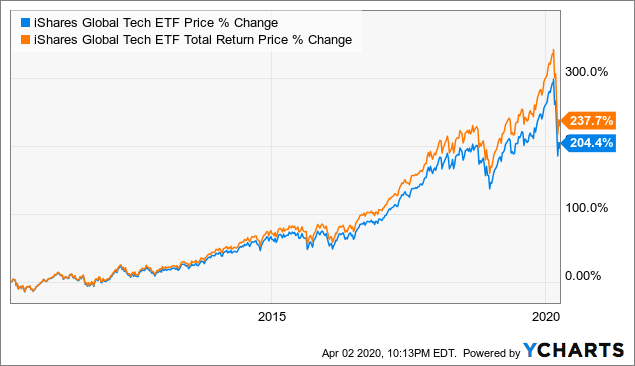 Data by YCharts
Fund Analysis
IXN's portfolio of stocks are stocks with moats and solid financial health ratings
Majority of IXN's stocks are large-cap and giant-cap stocks. In fact, nearly 95% of its portfolio consists of large-cap and giant-cap stocks. These are well-established companies that have sustainable business models and have the balance sheet to continue to support their growth strategies. Most of these stocks have products or services that are very sticky to their customers. Therefore, it is very difficult for its customers to switch to their competitors. For example, Apple (AAPL) has an ecosystem with multiple services (iTunes, cloud, etc.) that attract its customers to use its services. Similarly, Google (GOOG) (GOOGL) also offers multiple cloud services (e.g. Gmail, Google Drive, Calendar, etc.). Other companies such as Visa (V) and Mastercard (MA) should continue to enjoy strong network effect as they have large networks of merchants and card users that its customers will continue to rely on. Besides their competitive position that should help them to perform well, these are also companies that have good financial strength than their peers. As can be seen from the chart below, most of these stocks receive strong or moderate financial health ratings.
Ticker | Name | Morningstar Moat Status | Financial Health Rating | Weight (%) |
MSFT | Microsoft Corp. | Wide | Strong | 16.49 |
AAPL | Apple Inc. | Narrow | Strong | 16.12 |
V | Visa Inc. Class A | Wide | Strong | 4.26 |
SSNLF | Samsung Electronics | N/A | N/A | 3.36 |
MA | Mastercard Inc. Class A | Wide | Strong | 3.33 |
INTC | Intel Corporation | Wide | Moderate | 3.08 |
TSM | Taiwan Semiconductor Manufacturing | Wide | Strong | 2.87 |
CSCO | Cisco Systems Inc. | Narrow | Strong | 2.19 |
ADBE | Adobe Inc. | Wide | Strong | 2.15 |
NVDA | Nvidia Corp. | Narrow | Moderate | 2.06 |
TOTAL | 39.42 |
Source: Created by author
IXN should benefit from several technology trends
Although the outbreak of COVID-19 is causing some near-term headwind to information technology demand in 2020, we think the long-term growth outlook remains intact. Assuming COVID-19 can be contained in 2020, this sector should resume growth in 2021 and beyond. According to IDC, global information communication and technology spending is expected to reach over $6 trillion by 2022 (see chart below). IDC expects that these platforms such as cloud, mobile, social and big data will help drive growth in the next few years. Looking forward to longer term, stocks in IXN's portfolio should also benefit from several technology trends such as artificial intelligence, 5G, artificial intelligence, blockchain, virtual reality, etc.
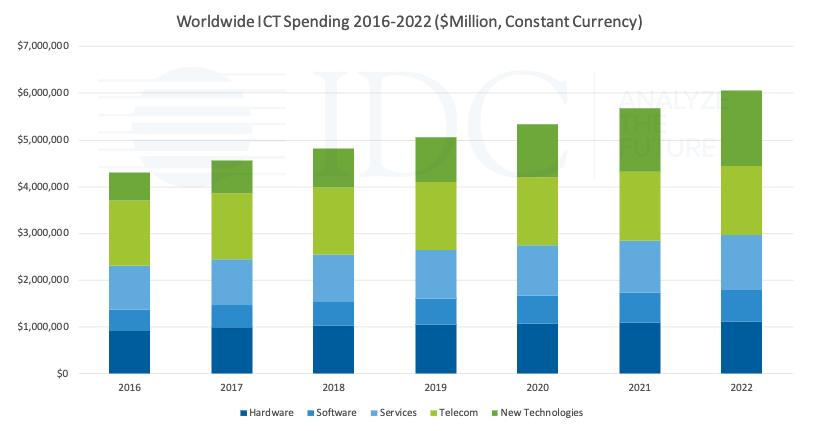
Source: IDC Website
As can be seen from the table below, software and services subsector consists of about 49% of IXN's total portfolio.
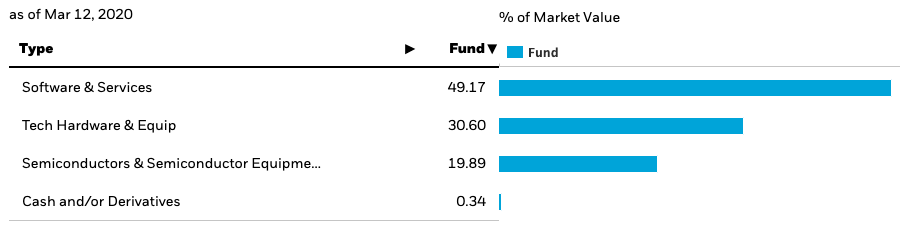
Source: iShares Website
This subsector has a long runway of growth in the next few decades. As can be seen from the chart below, global software market is expected to reach $1 trillion by 2030. This will be much higher than the current $550 billion in 2019. In fact, it is expected to grow by a compound annual growth rate of about 5% through 2050.
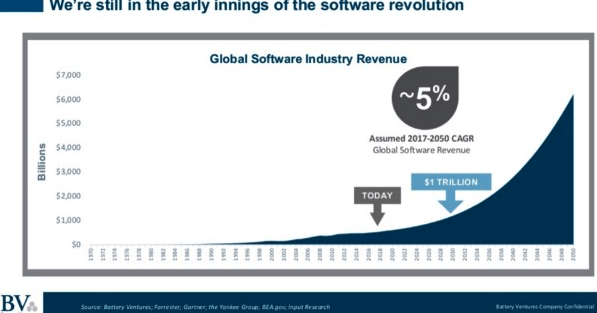
Source: Sand Hill
The remaining two subsectors in IXN's portfolio are technology hardware & equipment and semiconductor sectors. Below is a chart that shows semiconductor revenue growth by electronic equipment type in the next few years. As can be seen from the chart, growth is broad-based across different categories. Notable areas of growth include wearable devices (e.g. head mount display, smartwatches), electric vehicles, security, and other industrial applications. As can be seen, many equipment types will see strong revenue growth in the next few years.
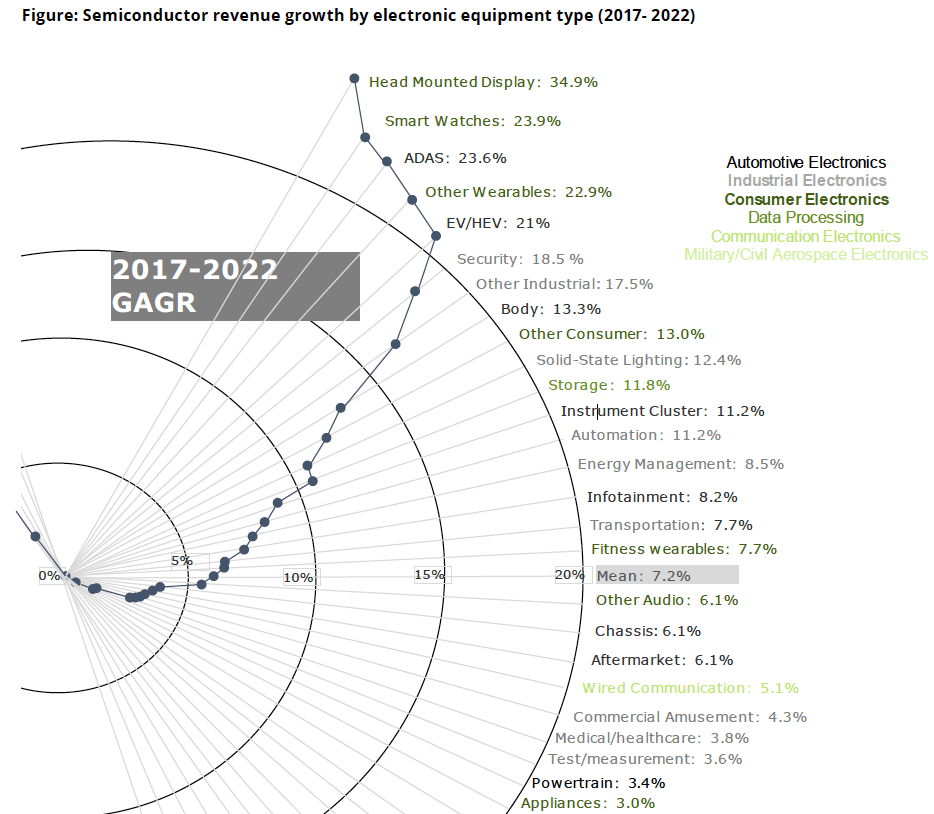
Source: Deloitte Analysis
IXN is not as richly valued as before, but is still not cheap enough
Following the recent stock market sell-off, IXN's valuation has gone a lot cheaper, but we still see it as slightly overvalued. Below is a table that shows the forward P/E ratio and 5-year average P/E ratios of IXN's top 10 holdings. As can be seen from the table, the weighted-average forward P/E ratio of IXN's top 10 holdings is 19.70x. This is still higher than its 5-year weighted-average P/E ratio of 18.61x.
| Ticker | Name | Forward P/E | 5-Year P/E | Weight (%) |
| MSFT | Microsoft Corp. | 24.39 | 22.35 | 16.49 |
| AAPL | Apple Inc. | 18.62 | 14.63 | 16.12 |
| V | Visa Inc. Class A | 27.32 | 26.47 | 4.26 |
| SSNLF | Samsung Electronics | 6.72 | 7.66 | 3.36 |
| MA | Mastercard Inc. Class A | 29.50 | 27.87 | 3.33 |
| INTC | Intel Corporation | 10.68 | 12.42 | 3.08 |
| TSM | Taiwan Semiconductor Manufacturing | 16.95 | 23.33 | 2.87 |
| CSCO | Cisco Systems | 11.57 | 13.86 | 2.19 |
| ADBE | Adobe Inc. | 30.58 | 31.30 | 2.15 |
| NVDA | Nvidia Corp. | 32.36 | 30.83 | 2.06 |
| WEIGHTED AVERAGE/TOTAL | 19.70 | 18.61 | 39.42 |
Source: Created by author
Now, let us compare IXN to the S&P 500 Index. As can be seen from the table below, IXN's P/E ratio of 18.79x is still higher than the ratio of 16.20x of the S&P 500 Index. Similarly, IXN's price to cash flow ratio of 13.19x is also much higher than the S&P 500 Index's 9.62x. IXN also has slightly inferior sales and cash flow growth than the S&P 500 Index.
IXN | S&P 500 Index | |
P/E Ratio | 18.79x | 16.20x |
Price to Cash Flow Ratio | 13.19x | 9.62x |
Sales Growth (%) | 5.88% | 6.92% |
Cash Flow Growth (%) | 5.72% | 7.62% |
Source: Morningstar, Created by author
Risks and Challenges
A concentrated portfolio
IXN has a concentrated portfolio. In fact, Microsoft (MSFT), and Apple accounts for about 16.49% and 16.12% of the portfolio, respectively. This concentration can introduce considerable risk especially if a single stock performs poorly than other stocks.
Economic recession
Stocks in IXN portfolio may experience declining revenues in an economic recession. In addition, negative market sentiment in an economic downturn may result in valuation contraction.
Investor Takeaway
IXN has a strong growth portfolio of moaty stocks that should continue to grow in the next decade. Although it is still slightly overvalued, given the strong growth outlook, it may be worth start initiating a position and average down on any price weakness.