Tracing the crash path
History repeats itself. This is often heard pretty much everywhere, financial markets being no exception. We look at history to make better decisions about the future as our ingrained optimism reminds us that things get better after every adversity.
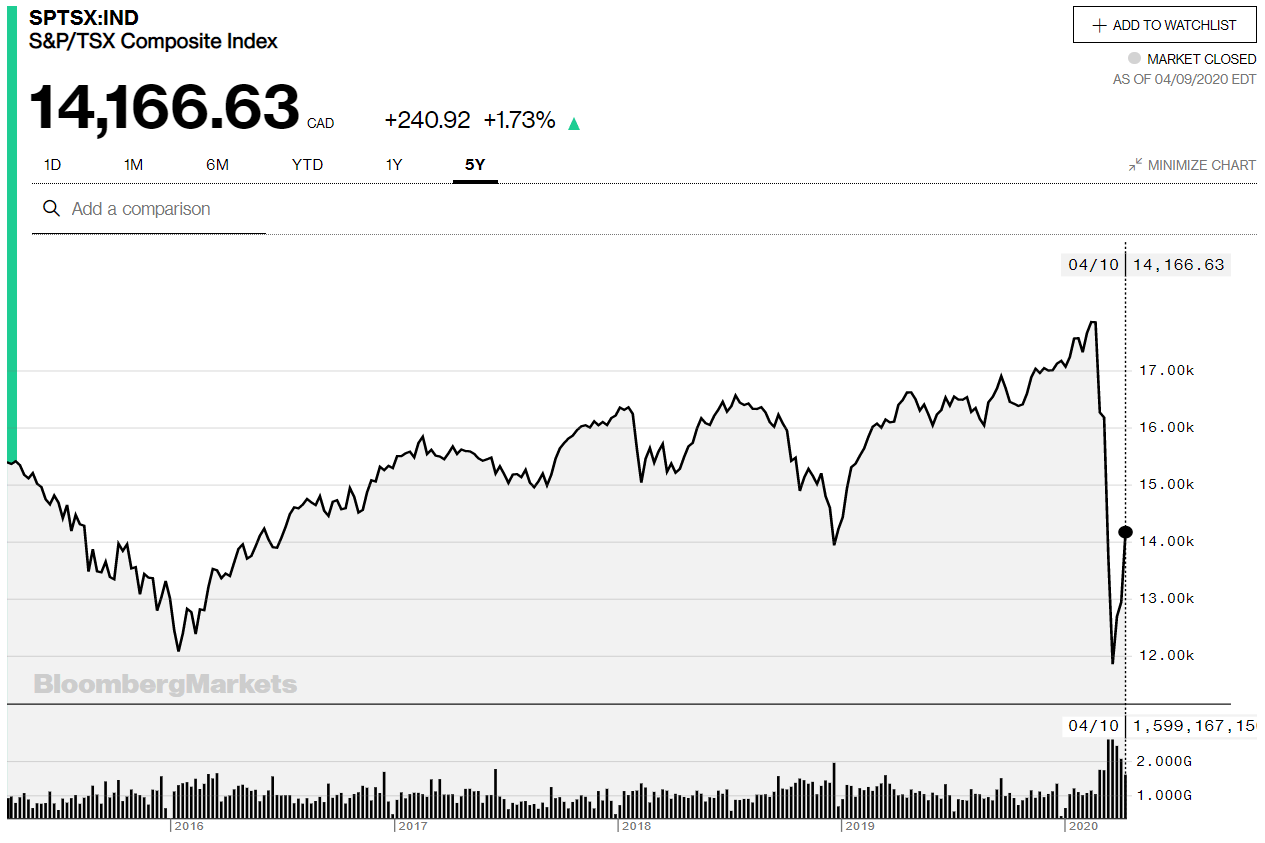
Canada's S&P/TSX Composite index is now up almost 26% after touching a low on March 23rd (closing basis) when it was down 37% from the Feb 20th peak touched before the COVID-19 fears swamped the global financial markets. With the recent gains, investors will again be weighing the trade-off between the fear of missing an opportunity and the risk of losing money.
 This pattern is nothing new as markets rarely rally in a straight line. In his latest memo, billionaire investor, Howard Marks of Oaktree Capital talks about how comeback rallies and pullbacks have been a hallmark of the Dotcom Crash of 2000/01 and Global Financial Crisis of 2008/09. He presented the following data to drive home his earlier message that "Investors should have some money left (and hopefully the nerve) to buy more" if markets reverse course and go down further.
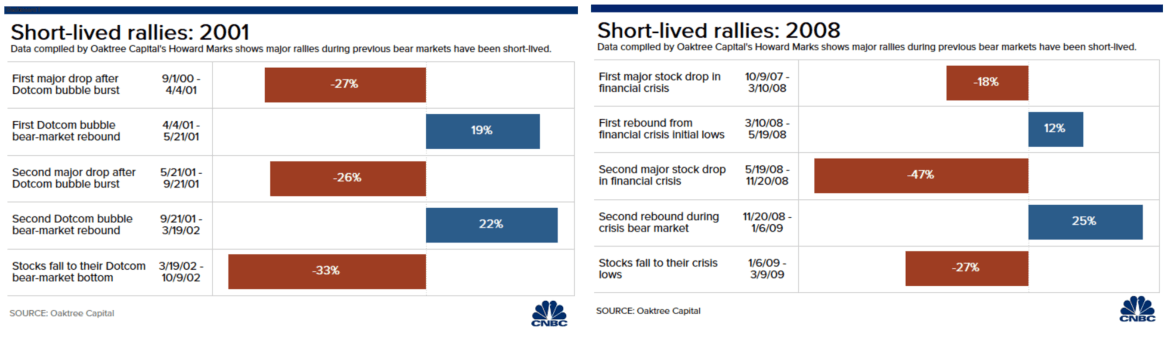 Source: CNBC/Oaktree Capital
Lets compare the performance of Canadian stocks after COVID-19 peak by re-tracing previous major crashes in history like the Black Monday of 1987, the Dotcom Bubble Burst of 2000 and lastly the Global Financial Crisis of 2008.
Black Monday 1987
The first episode that we look at is the global stock market crash of Black Monday 1987. In hindsight, it seems like a mere pricking of a stock market bubble although at that time it had people thinking of a reprise of the 1929 stock market crash and the subsequent Great Recession of 1930s.
In Canada, the S&P/TSX Composite lost 11% on Black Monday and another 7% on the day after, cumulatively losing 21% over eight trading