Precious metals markets are seeing a swift round of new buying activities with everyone from individual retail traders to central banks getting into the mix. However, the iShares Silver Trust (NYSEARCA: SLV) has failed to participate in these bullish trends and the ETF has lost 16.7% since February 24th, 2020. Clearly, something is wrong with this picture, but since many investors likely missed the recent rallies in sector counterparts like the SPDR Gold Trust (NYSEARCA: GLD), instruments like SLV might represent one of the last remaining value plays in the entire metals complex. For these reasons, we see tremendous upside potential in SLV and all dips related to the ETF should be viewed as new buying opportunities.

Source: Author, TradingView
While recent trends in SLV might seem like a total disappointment for investors holding long positions, the reality is that the longer-term trends support the outlook for sustainable gains. Over the last year, net flows in SLV have risen to $1.52 billion even with the minor outflows that were present during the final weeks of March 2020:

Source: ETFdb
Clearly, the weakest periods for the ETF were visible during the periods that stretched from between September 2019 to March 2020. For the most part, flow activities in 2020 have actually been quite favorable for the ETF even while general sentiment assessments seem to be pointing in the other direction.
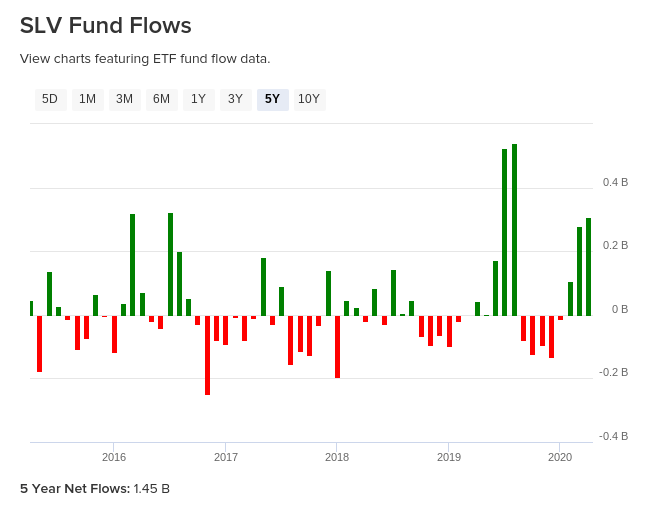
Source: ETFdb
If these figures are not convincing enough, longer-term investors might want to consider extending the viewpoint to broader time horizons. In this case, we can extend the view to assess the last five years and this will show that many of the same trend results remain visible. During the last 5-year period, net flows in SLV have risen to $1.45 billion. Overall, this points to a sharp recovery from the bearishness that was visible in 2017 and