Leggett & Platt (NYSE:LEG) looks appealing still trading near 52-week lows and at 10.5x TTM P/E with great cash flow characteristics. While not a consumer-facing name that most investors will be familiar with, Leggett & Platt has a long profitable history dating back to 1883 with an average ROE and ROIC of 21.2% and 12.4%, respectively, over the past decade. The company's rather boring products based in seating and mattresses make it a sleeper of a company that has not participated in the recent market rebound.
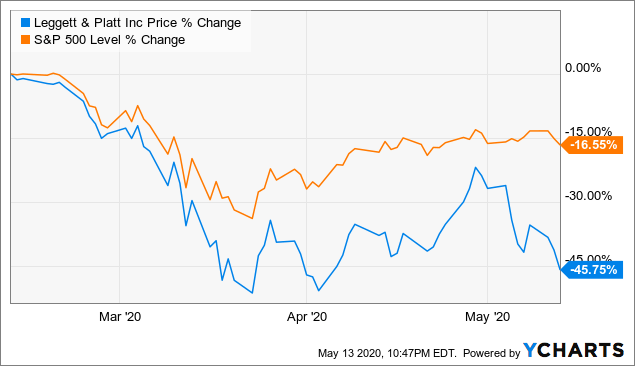 Data by YCharts
Intro To The Company
Leggett & Platt was founded in Missouri in 1883 and was a pioneer of the steel coil bedspring. This expertise helped the company become an internationally diversified manufacturer that conceives, designs and produces a wide range of engineered components and products found in many homes and automobiles. The company recently reorganized the reporting structure into three segments: Bedding Products, Specialized Products, and Furniture, Flooring & Textile Products but the broader product mix can be seen below with Bedding making up the bulk of sales (47%), followed by Automotive (17%), and Flooring & Textiles (17%) to highlight the top three biggest product groups.
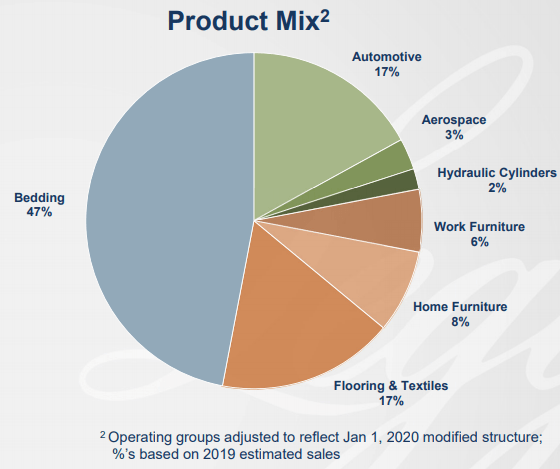
Sourced from Leggett & Platt 2019 Investor Day presentation
In January 2019, Leggett & Platt completed the acquisition of Elite Comfort Solutions for cash consideration of approximately $1.3 billion. This is a recent and sizable acquisition given Leggett & Platt's current market cap of of $3.6 billion so I believe it deserves special mention. Elite Comfort Solutions, headquartered in Newnan, Georgia, is a leader in proprietary specialized foam technology, primarily for the bedding and furniture industries. With 16 facilities across the United States, Elite Comfort Solutions operates a vertically-integrated model, developing many of the chemicals and additives used in foam production, producing specialty foam, and manufacturing private-label finished products.
Profitable And Growing
Leggett & Platt's niche product portfolio has allowed it to achieve an average return on equity (ROE) and return on invested capital (ROIC) of 21.2% and 12.4%, respectively, over the past decade. This level of profitability is well above my rule of thumb of 15% ROE and 9% ROIC, allowing me to be confident that, in my opinion, the company is able to maintain and continue to increase its intrinsic value over a business cycle.
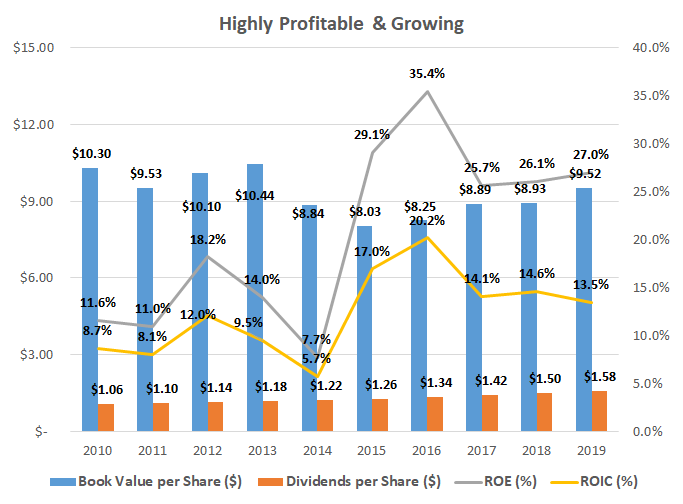
Source date from Morningstar
Great Cash Flow Generation
To get an idea of the sustainability of dividends and share repurchases, we can take a look at what percent of cash flow from operations is available to be returned to shareholders after making the necessary capital expenditures. As can be seen below, Leggett & Platt does a decent job of returning cash flow to shareholders in the form of dividends and share repurchases. With capital expenditures and acquisitions only taking up on average 49% of cash flow from operations over the past decade, this leaves approximately 51% to be returned to investors in the form of dividends and share repurchases. With average cash flow from operations of $492.8 million over the past five years, this 51% would imply free cash flow to shareholders of $251.6 million for around a 7.7% free cash flow yield at the current $3.3 billion market capitalization.
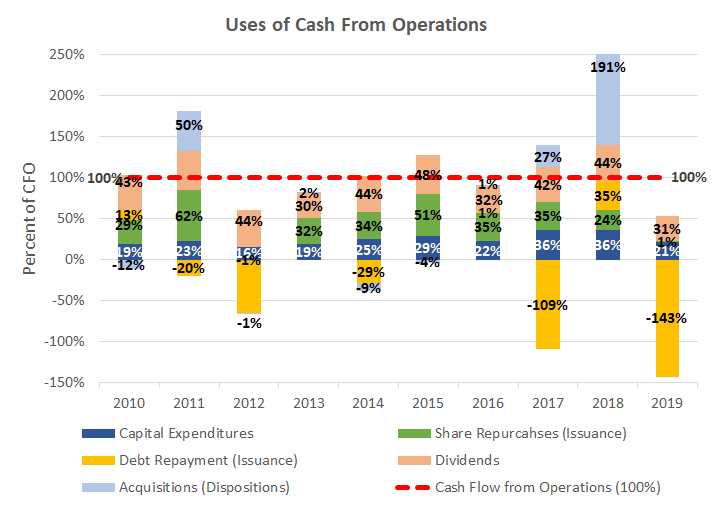
Source data from Morningstar
If we exclude 2019 with the unusually large Elite Comfort Solutions acquisition from the average capital expenditures and acquisitions figure, this drops the average spending level to 31% and leaves 69% to be returned to shareholders through dividends and share repurchases. With this lower level of spending, the free cash flow yield jumps up to 10.5% given the current market cap. That being said, excluding 2019's unusually large acquisition from the average might be a little aggressive as the acquisition still needs to prove itself and who knows what the next decade will hold. On the other hand, given the recent drop in Leggett & Platt's market cap from the time that acquisition was made, investors are practically getting that new business for free.
How About The Debt?
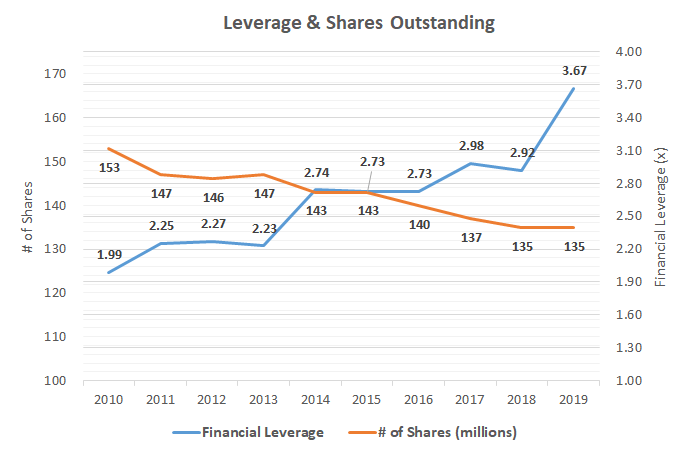
Financial leverage at Leggett & Platt has seen a notable rise since the beginning of the decade, with the company making a definitive change in capital structure. Financial leverage has moved from 1.99x in 2010 to a considerably higher 3.67x in 2019 alongside the company's acquisition of Elite Comfort Solutions. Given the low interest rate environment experienced along with the rise in debt, the company's interest coverage ratio remains a reasonable 5.8x in 2019.
Source date from Morningstar
Over the past decade, the company has also repurchased 11.8% of its outstanding for an average annual repurchase rate of 1.4% which, when combined with the current dividend yield of 5.9%, brings total shareholder yields to 7.3%. I always like to see share repurchases from a business as they show capital budget discipline and long-term faith in the existing business from management and the board of directors while returning cash to shareholders in a tax-efficient manner.
Takeaway
Leggett & Platt looks appealing near 52-week lows and trading at 10.5x TTM P/E. The company has great cash flow characteristics with free cash flow yields around 7.7% at current prices and 10.5% if we exclude the large acquisition in 2019. The company has a long and profitable history in a niche market and it is looking like a good time to become a long-term investor.
If you enjoyed this article and would like to read more of my work, click the follow button at the top of the page to receive notifications when I post a new article!