It seems that natural gas prices have hit a bottom. As shown below, the Henry Hub natural gas futures end of the day sentiment price for June 2020 contract went below the March 2016 low of $1.70/mmBTU on Friday. The futures popped to $1.83/mmBTU on Monday before settling at $1.79/mmBTU. Not too long ago, it was $2.65/mmBTU in November of 2019. With demand for natural gas expected to rise and supply appearing to be falling, this looks like a great time to try to profit from the rise in natural gas prices. Buying the VelocityShares 3x Long Natural Gas ETN linked to the S&P GSCI Natural Gas Index ER (UGAZ) is a risky but potentially highly profitable way to play the rise.
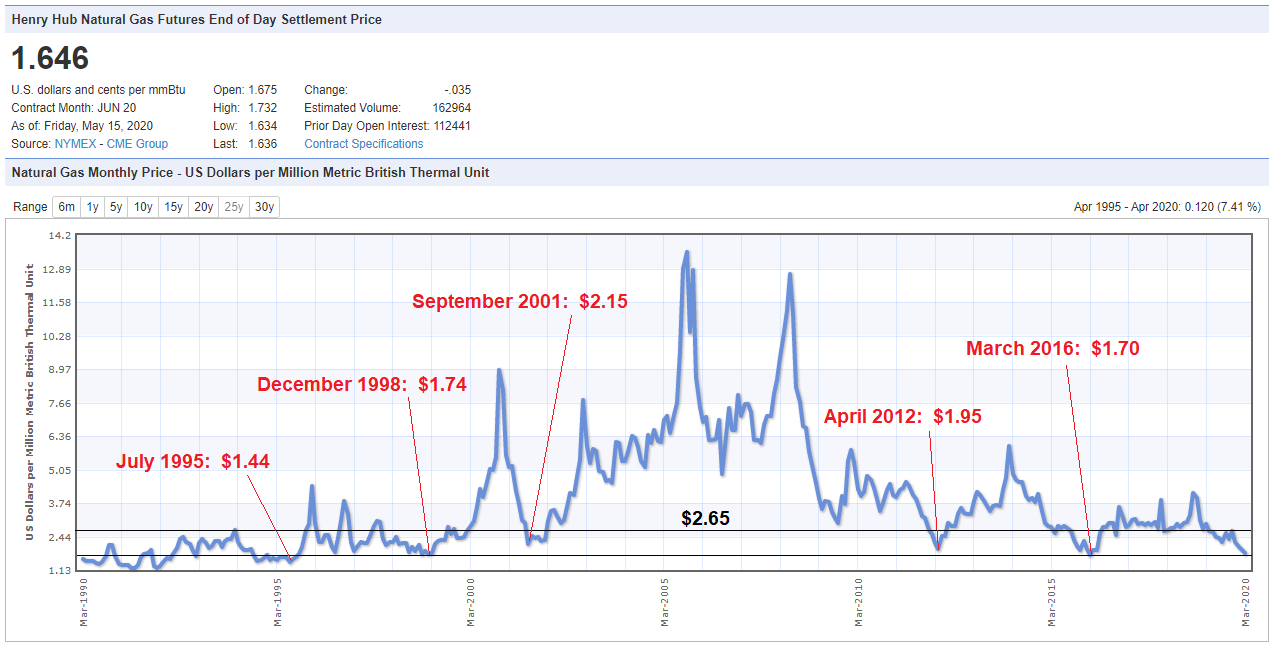
Source: Henry Hub Natural Gas Futures End of Day Settlement Price
The Henry Hub natural gas price is slightly different than the futures price. Below is the long-term graph of the Henry Hub natural gas price not adjusted for inflation, and there is a slight difference. In 2012 and 2016, the bottom for the actual Henry Hub price was one month before the bottom in the futures. But in 2001, the bottom was the same month. The price was also about $0.20-$0.30 different, but the general trend was the same.
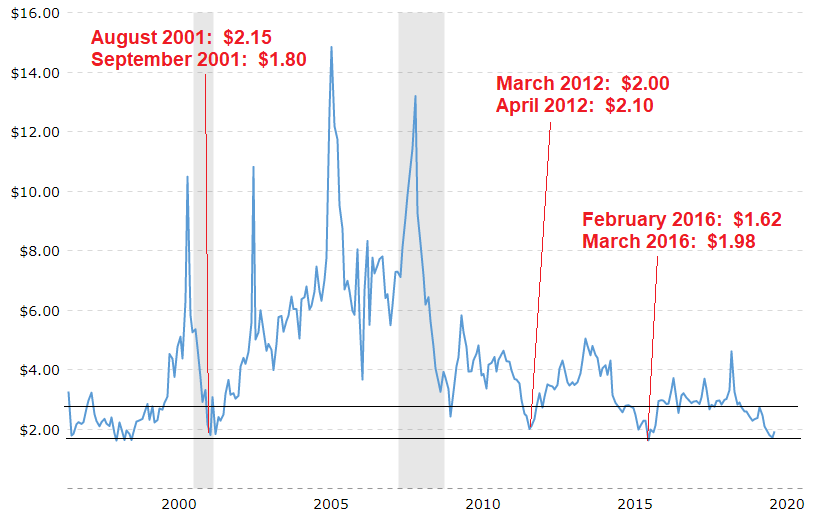
Source: Henry Hub Natural Gas Price
Technicals
On the left of the image below is the 5-year technical graph of natural gas. The price made two similar plunges in early 2016 and early 2020. The 2016 plunge formed a nearly symmetrical V-shaped pattern with the center (and bottom) in April. The price bottomed at second support with an RSI of about 20 and a W%R of about -95. The 2020 plunge is not a symmetrical V-shaped pattern. The price bottomed at third support with an RSI of about 35 and a W%R of about -95. Three times of the six when the RSI, W%R, and MACD were at similar levels, natural gas rose as shown by the orange lines.
The 6-month graph on the right of the image below shows that the price of natural gas formed a bottom in April at about $1.56/mmBTU and has been oscillating in an increasing channel. The price formed a bullish rounded bottom with a target of $2.30/mmBTU. The upper Bollinger Band is $2.12/mmBTU, which is almost the same as the 200-dma. The 200-dma can be seen as significant resistance. Natural gas has an RSI of 48.82 (slightly more oversold than overbought) and a W%R of -66.84 (more oversold than overbought). In three of the five times when the RSI and W%R were at similar levels, natural gas rose as shown by the orange lines.

Source: Stockcharts.com
Supply And Demand Of Natural Gas
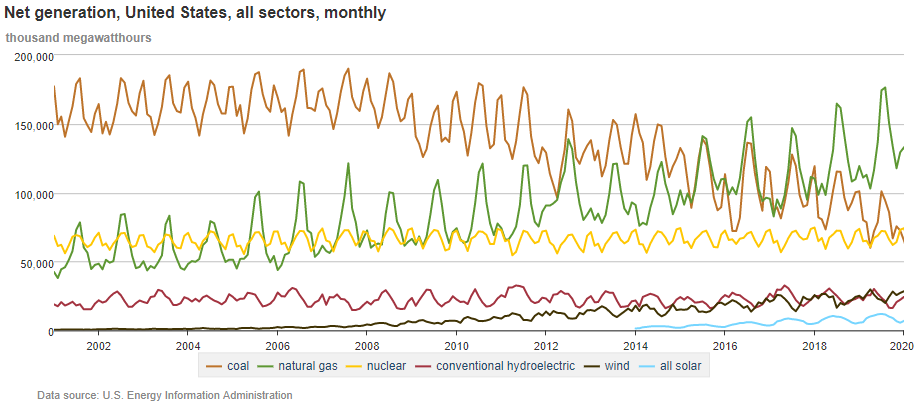
As shown below, 35% of natural gas demand in the United States is used for electric power. And out of the five categories of use (electric power, industrial, residential, commercial, and transportation), electric power is the only category that is growing significantly.

Source: EIA: Use of natural gas
As shown in the graph below, natural gas demand for electricity generation seems to bottom every April/May and spike till November with a peak in July.
Source: EIA: Electricity Data Browser
The electricity generation graph is nearly the opposite of U.S. natural gas consumption, which seems to always spike from September to May with a peak in January. Then there is a much smaller spike from May to September with a peak in July/August. In May 2018 and May 2019, natural gas consumption was 2.051 and 2.121 trillion cubic feet respectively. Assuming consumption follows the green lines shown in the graph below, May 2020 consumption would be 2.191 trillion cubic feet. Doing the same calculation for July/August consumption, July/August 2020 consumption would be 2.529 trillion cubic feet.
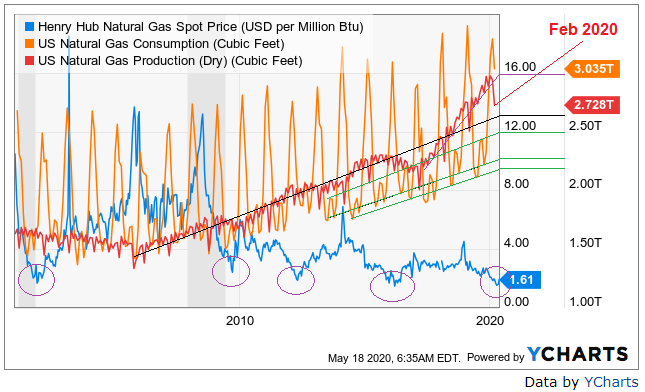
Source: YCharts
Meanwhile, U.S. natural gas production has been generally rising over much of the last 15 years as shown by the black line in the graph above. Then production started following a new trendline (purple) in 2015. Production seems to dip every February and bounce back in March. If production follows the purple line, about 3.0 trillion cubic feet of natural gas would be produced in May 2020. If production falls to the black line, about 2.6 trillion cubic feet of natural gas would be produced in May 2020.
In the six months around the current low price of natural gas, consumption estimates (green) crossed below production estimates (purple) in mid-March as shown below, leading to a plunge in price.
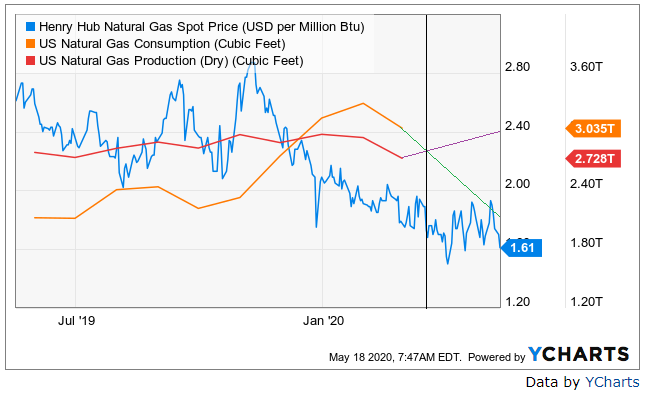
Source: YCharts
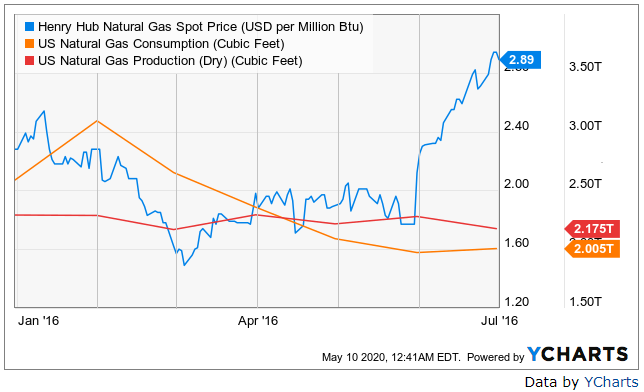
In the six months around the 2016 low price of natural gas, consumption (orange) crossed below production (red) in early April as shown below. But price only dipped for a short while before continuing to climb higher. There must be something else driving natural gas price.
Source: YCharts
In 2016, the natural gas rig count hit a low about the same time the price hit a low. But the rig count stayed low till about August 2016, and that probably boosted the price. Currently, the natural gas rig count hit about the same low. If the rig count stays low for an extended period of time, the price may jump.

Source: YCharts
UGAZ: Risks And Correlation
One way to take advantage of swings in natural gas is to trade the VelocityShares 3x Long Natural Gas ETN (UGAZ). The ETN or exchange traded note is a debt security issued by Credit Suisse AG (CS). The note is designed to provide a return of three times (3x) the daily performance of the S&P GSCI (Goldman Sachs Commodity Index) Natural Gas ER (Excess Return) Index. The note is only designed to triple the performance for one day and returns after one day can greatly vary. Thus, the note is designed for trading and is not meant to be held long term.
As shown by the green lines below, UGAZ has managed to follow the price movement of the Henry Hub Natural Gas Index well.

Source: YCharts
But the ETN has an obvious decay which is a fact about all leveraged ETFs. From the graph above, the decay could be approximated by looking at where the price was for roughly equal Henry Hub prices. On April 16, the Henry Hub price was $1.59/mmBTU, and the price of UGAZ was $26.27/share. On May 13, the Henry Hub price was $1.61/mmBTU, and the price of UGAZ was $16.36/share. Thus, over 27 days, the price of UGAZ declined $9.91/share despite that the Henry Hub price was roughly the same. Using a straight line, that is a decay of about $0.367 per day or 1.40%
$0.367 / $26.27 = 1.397%
However, the calculations from the price graph gives a decay about half that. The graph below shows that the price over the last year roughly oscillated around a declining exponential trendline. Using 5/18/2020, the trendline gives a price of $23.31/share. Using 5/19/2020, the trendline gives a price of $23.16/share. That gives a decay of 0.648%.
($23.31 - $23.16) / $23.31 = 0.648%
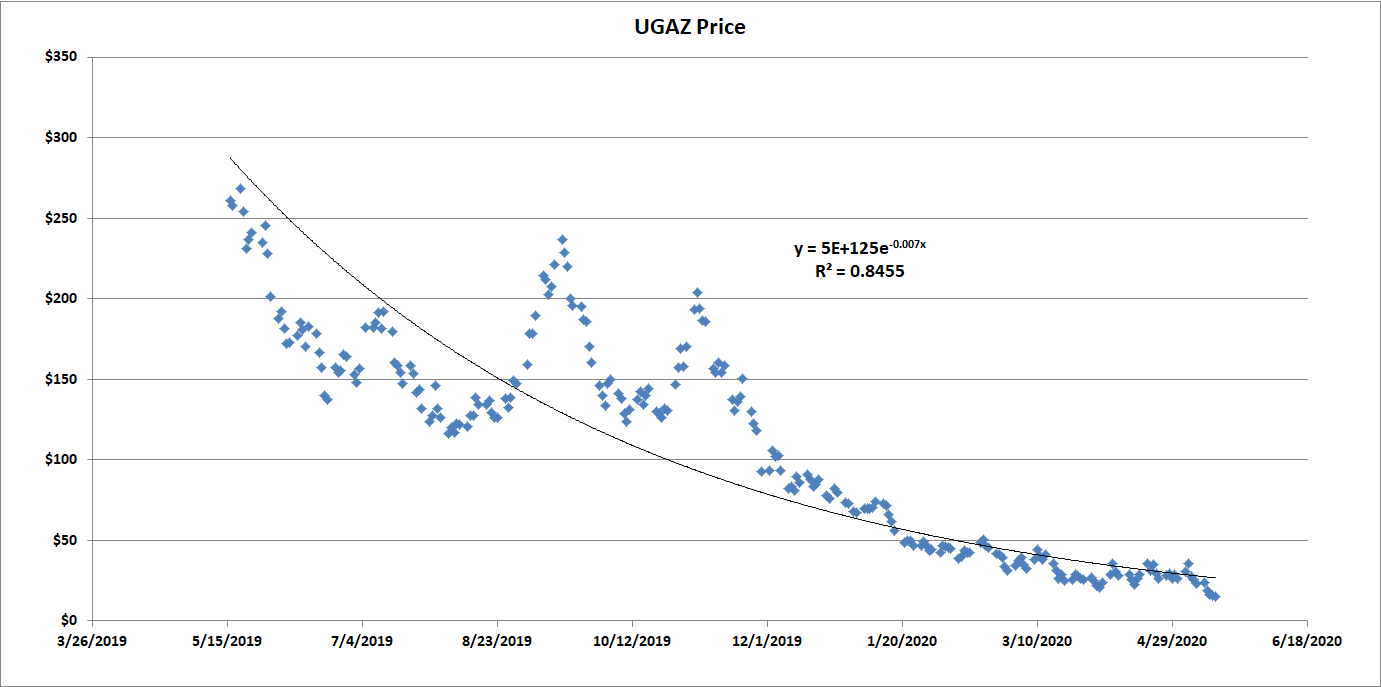
Source: UGAZ Price History
Another risk to consider is that since an ETN is a debt security like a bond but issues no interest, it can be halted if the fund’s issuer cannot effectively hedge its position. This happened to the inverse VIX ETN (XIV) on February 20, 2018.
Below are two graphs comparing how UGAZ (blue line) traded to natural gas (orange line) around the 2012 and 2016 bottoms. The last graph on the right is the current graph of UGAZ and natural gas.

Source: YCharts
In both 2012 and 2016, the price of UGAZ bottomed one day before the price of natural gas as shown by the green line.
- In 2012, the short-term price movement of UGAZ both increased and decreased much more than natural gas. On April 20, natural gas bottomed at $1.82/mmBTU and increased to $2.66/mmBTU on May 24, a gain of 46.2% over 34 days. On April 19, UGAZ bottomed at $183,000/share and increased to $424,750/share on May 18, a gain of 132.1% over 29 days.
- In 2016, the short-term price movement of UGAZ nearly matched that of natural gas. On March 4, natural gas bottomed at $1.49/mmBTU and increased to $2.01/mmBTU on April 13, a gain of 34.9% over 40 days. On March 3, UGAZ bottomed at $1,675/share, increased to $2,644/share on March 17 (a gain of 57.9% over 14 days), and increased to $3,075/share on April 22 (a gain of 83.6% over 50 days).
- In 2020, the short-term price movement of UGAZ seems to be nearly matching that of natural gas. Natural gas seems to have hit a bottom at $1.61/mmBTU on May 13. If it follows a similar movement to 2016, natural gas could rise to $2.17/mmBTU by June 22 (40 days). On May 15, UGAZ hit a low of $15.21/share and could hit $24.01/share by May 29 (14 days) and $27.92/share by July 4 (50 days).
Technicals show that the recent price oscillated between support and second resistance three to four times before plunging below support. The price movement formed a bearish triple top with a target of about $14.50/share that it recently hit. Now, I expect the price to retest the support line around $24/share. The lower Bollinger Band is $13.89/share, the midpoint is $25.37/share, and the upper Bollinger Band is $37.44/share. The ETN has an RSI of 41.24 (more oversold than overbought) and a W%R of -85.49 (oversold). In three of the five times when the RSI and W%R were at similar levels, UGAZ rose as shown by the orange lines.

Source: Stockcharts.com
Conclusion
I think the VelocityShares 3x Long Natural Gas ETN linked to the S&P GSCI Natural Gas Index ER (UGAZ) has a good chance of rising to about $24/share.