It is common knowledge that markets have seen quite the roller coaster ride over the last three months, but how does the realized volatility compare to other stress periods? To answer this question, I looked at the variability in daily returns for the S&P 500 (NYSEARCA:SPY) from the February 19th peak through yesterday's close. I then compared that calculation to rolling periods of similar lengths over a market dataset dating back to 1927. Put more precisely, I calculated the annualized standard deviation of daily returns for the S&P 500 and its predecessor indices for every 79-day trading session period over the last 92-years.
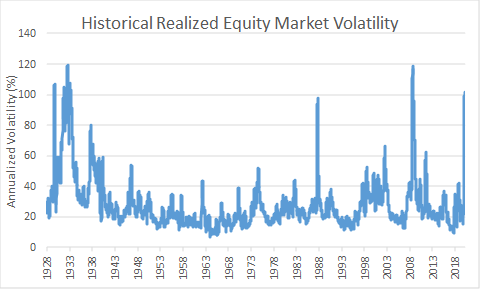
It gave me a graph that looks like this:

The last paragraph was a lot of words for a pretty simple picture. The spike in volatility over the past 3-4 months registers as an historical outlier.
Here are my takeaways from this data:
- The realized volatility of the "2020 coronacrisis" has eclipsed ever other market period except late 2008/early 2009 and the early stages of the Great Depression.
- One of the notable features for the increase in volatility in the current episode was that it came off such a low base. In the 2008-2009 episode, volatility had been rising for some time. The 2020 exogenous shock is more reminiscent of the 1987 stock market crash (although more of those losses came in a single trading day).
- Past stress events (Eurozone sovereign debt crisis/U.S. downgrade, tech bubble deflation/2001 recession/September 11th, the OPEC oil embargo and stagflationary recession of the mid-1970s all paled in comparison to the volatility experienced in the current environment.
I believe there are some lessons for investors to be taken from this information. Stress periods end. Over a long-time horizon, spikes in elevated volatility have proved short-lived on a longer scale even though they can feel daunting