The market gyration in March this year offers a good opportunity to stress test various instruments such as ETFs and mutual funds. In this article, we take a closer look at how bond ETFs behaved.
Broad-based stock index ETFs
The good news is that most broad-based stock index ETFs did withstand the volatile period in March and had no large discrepancies compared with their mutual fund counterparts. For example, the following chart shows each broad-based index ETF matched its mutual fund counterpart pretty well, even in the lows of March this year:
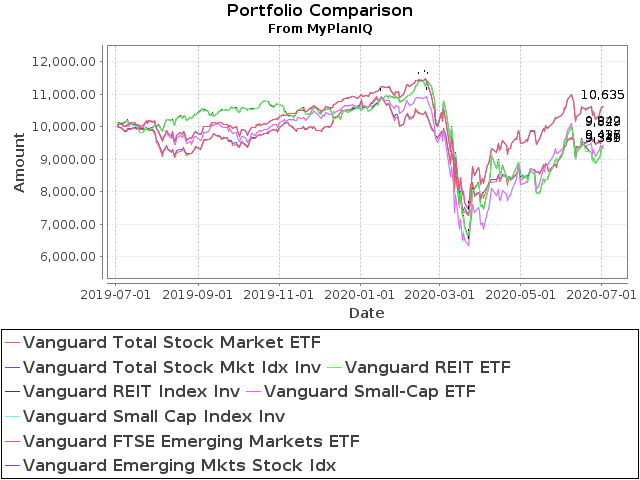
ETFs vs. Mutual Funds (as of 7/2/2020):
| Ticker/Portfolio Name | YTDReturn** | 1Yr AR | 3Yr AR |
|---|---|---|---|
| (VTI) Vanguard Total Stock Market ETF | -2.5% | 6.4% | 10.4% |
| (VTSMX) Vanguard Total Stock Mkt Idx Inv | -2.5% | 6.4% | 10.4% |
| (VNQ) Vanguard REIT ETF | -12.2% | -6.6% | 3.2% |
| (VGSIX) Vanguard REIT Index Inv | -12.3% | -6.6% | 3.0% |
| (VB) Vanguard Small-Cap ETF | -11.4% | -5.7% | 4.1% |
| (NAESX) Vanguard Small-Cap Index Inv | -11.4% | -5.8% | 3.9% |
| (VWO) Vanguard FTSE Emerging Markets ETF | -7.0% | -1.6% | 3.0% |
| (VEIEX) Vanguard Emerging Mkts Stock Idx | -7.1% | -1.7% | 2.9% |
Notice that in the above, even a narrower sector REITs ETF (VNQ) still matched its mutual fund counterpart VGSIX well.
In general, mutual funds are priced using the end of day prices and their NAVs (Net Asset Values) are decided by their underlying holdings' closing prices. Their NAVs are more stable than ETFs' prices as these are traded continuously in an exchange during market hours.
Because of ample liquidities among stocks (especially from reasonably sized small caps up), stock ETFs didn't exhibit large discrepancies against their mutual fund counterparts.
During the last three serious market routs (2000 internet bubble, 2008 financial bubble, and the recent COVID scare), other than some brief intro-day glitch, broad-based index stock ETFs have matched well.
Bond ETFs
Unfortunately, the