Annaly Capital Management (NYSE:NLY) is the largest of the mortgage REITs. It has clearly stumped many investors. The high dividend yield attracts investors and the interest from investors brings in analysts. Most analysts stick to neutral and bullish ratings, but we've mixed in bearish ratings as needed.
For instance, we called out shares when they became extremely expensive in February of 2020:
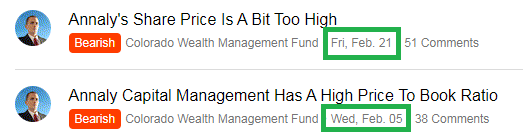
Source: Seeking Alpha
To create a stark contrast, those were the only 2 bearish articles with NLY as the primary ticker in more than a year. I didn't say "our only 2", I said "THE only 2". Across all of Seeking Alpha, those were the two.
Note: Scott Kennedy also provided warnings in his articles on The REIT Forum.
To demonstrate how expensive Annaly was in February, we pulled a chart using Annaly's "Total Return Price":
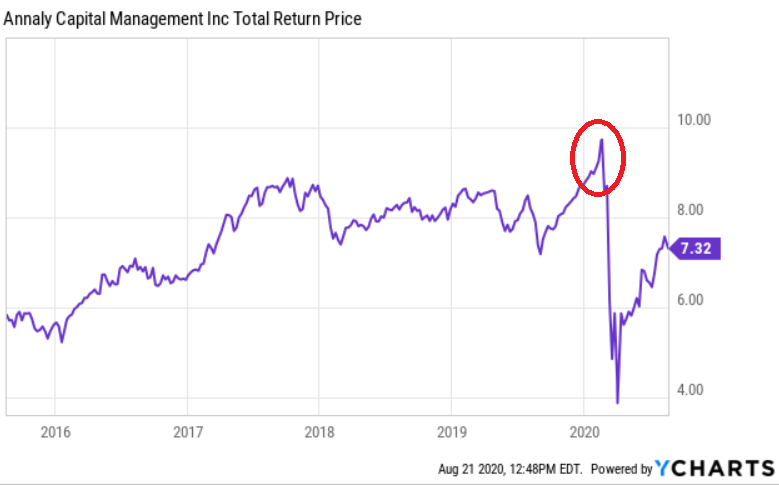
This chart adjusts the past prices to reflect the benefit of dividends earned since then. Consequently, it gives us a simple way to look at pricing without needing to worry about how many dividends were earned since a given date. They are already included. It is pretty clear that February was a really terrible time for investors to be purchasing NLY.
How Could We Possibly Have Known?
The following chart contrasts the trailing book value for Annaly Capital Management with the share price:
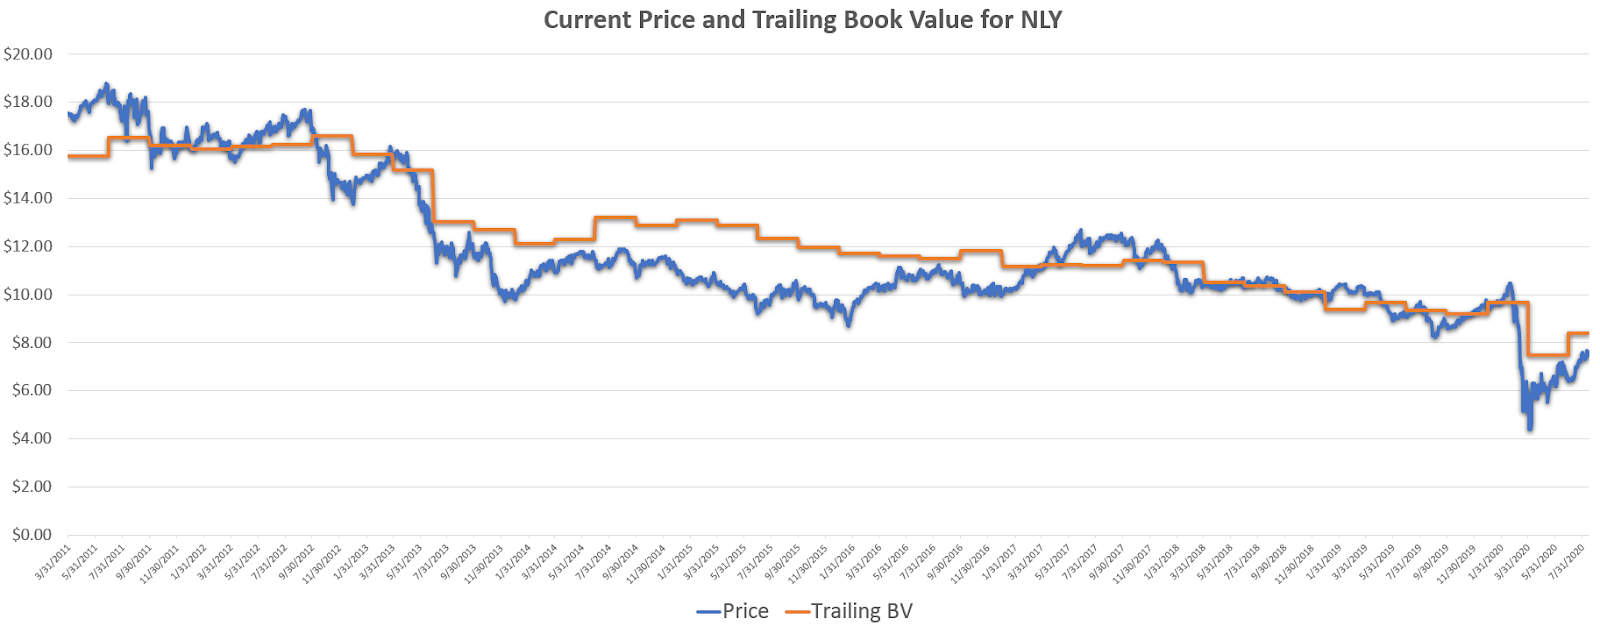
Source: Book Value data from TIKR.com and chart by author
Note: We applied each book value based on when the quarter ended, which is before the earnings release is actually published. For instance, the company's book value for 3/31/2019 is charted from 3/31/2019 to 6/30/2019 regardless of the date it was reported. If you've followed my work for a while, you'll know that we estimate changes in book value frequently. Scott sends out frequent updates to REIT Forum subscribers, so we aren't waiting until the announcement comes out.
We also prepared a chart turning those two lines into a ratio:
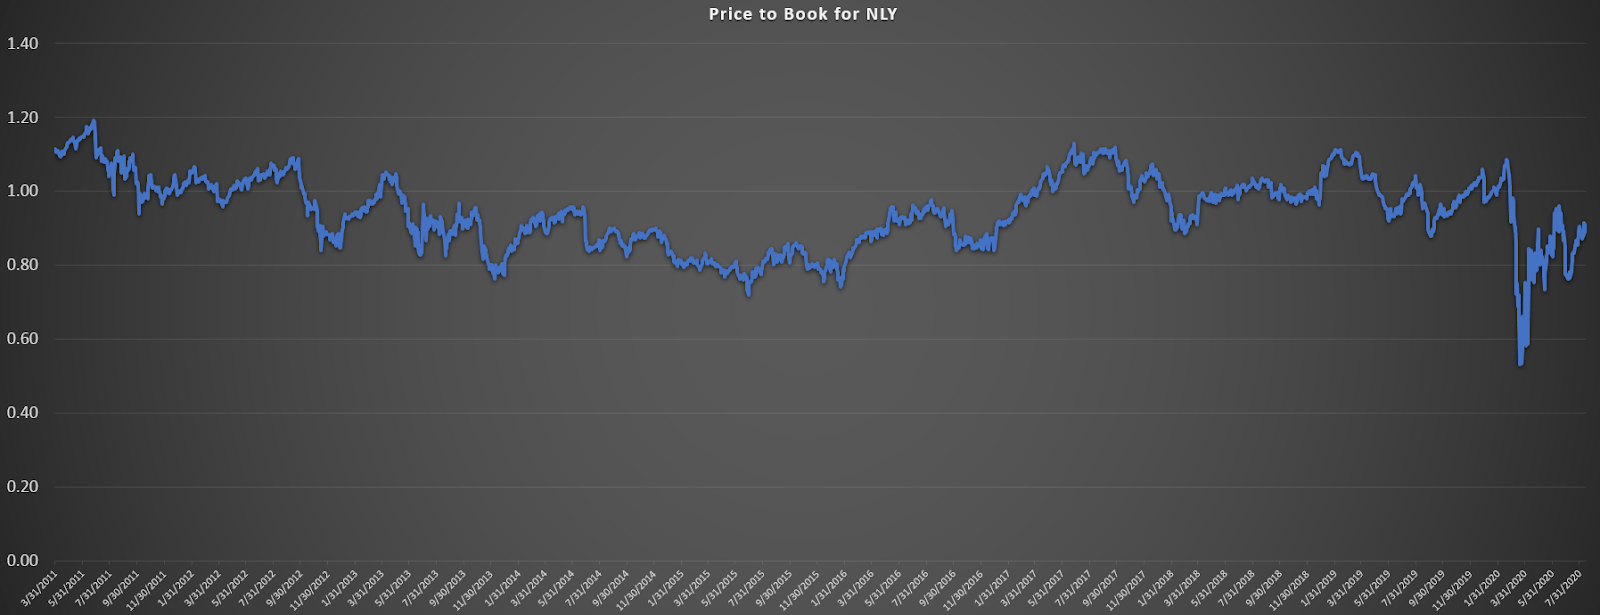
Source: Book Value data from TIKR.com and chart by author
Clearly the values tend to range between about 1.10 and 0.80 most of the time. That's a pretty normal range. Can we really do anything useful with this? We need to chart a smaller period so we can enlarge things. Don't worry about scrolling back for charts, each time we reference one we will provide an updated image to highlight the part we want you to focus on.
Let's zoom in closer on the action since January 1st, 2016:
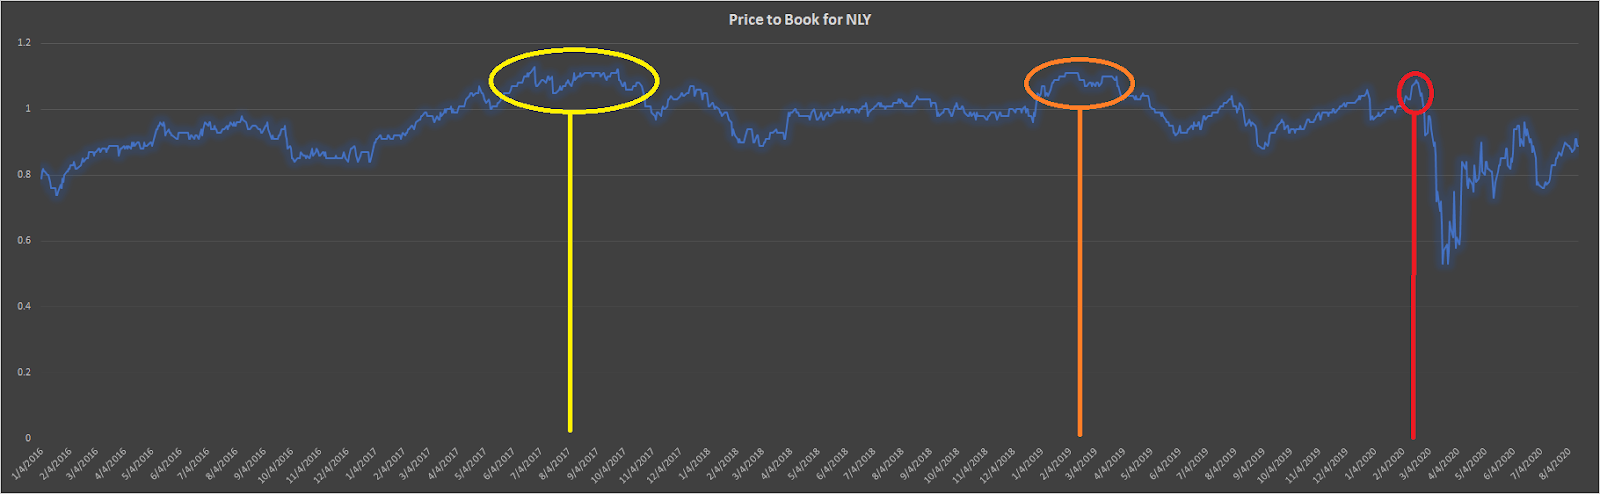
Source: Book Value data from TIKR.com and chart by author
Just like the first chart, we've added a red circle around February. We've also added an orange circle to represent early 2019 and a yellow circle to represent the period from late Q2 2017 through early Q4 2017.
Let's contrast that with the chart for total returns:
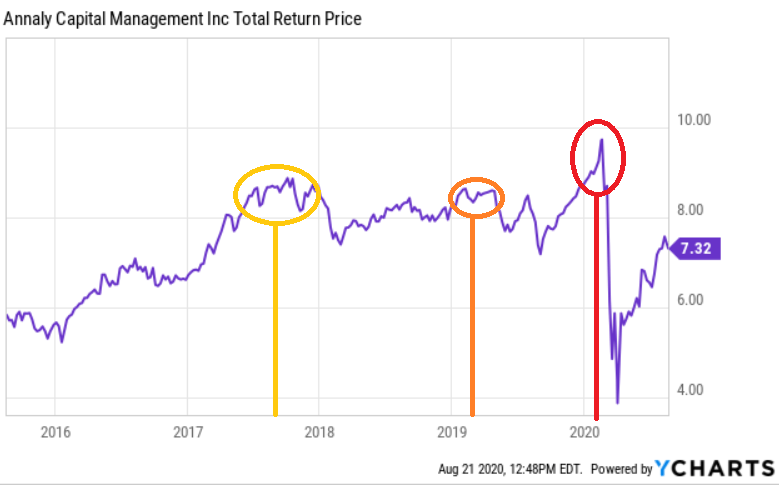
What you see in this second chart is that the worst times to buy NLY were generally inside the circles.
Simply using a chart of price-to-book ratios with the trailing book value (worse than having current book value), we were able to circle the worst times to buy. This doesn't just apply to NLY, we could use this system on other mortgage REITs as well.
There are two points investors should grasp firmly at this point:
A normal ratio for price-to-trailing-book-value is anywhere in the range of 1.10 to 0.80.
When the number is closer to 1.10, shares are less appealing.
Was This Clear in Real-time?
Let's go back to late 2017:
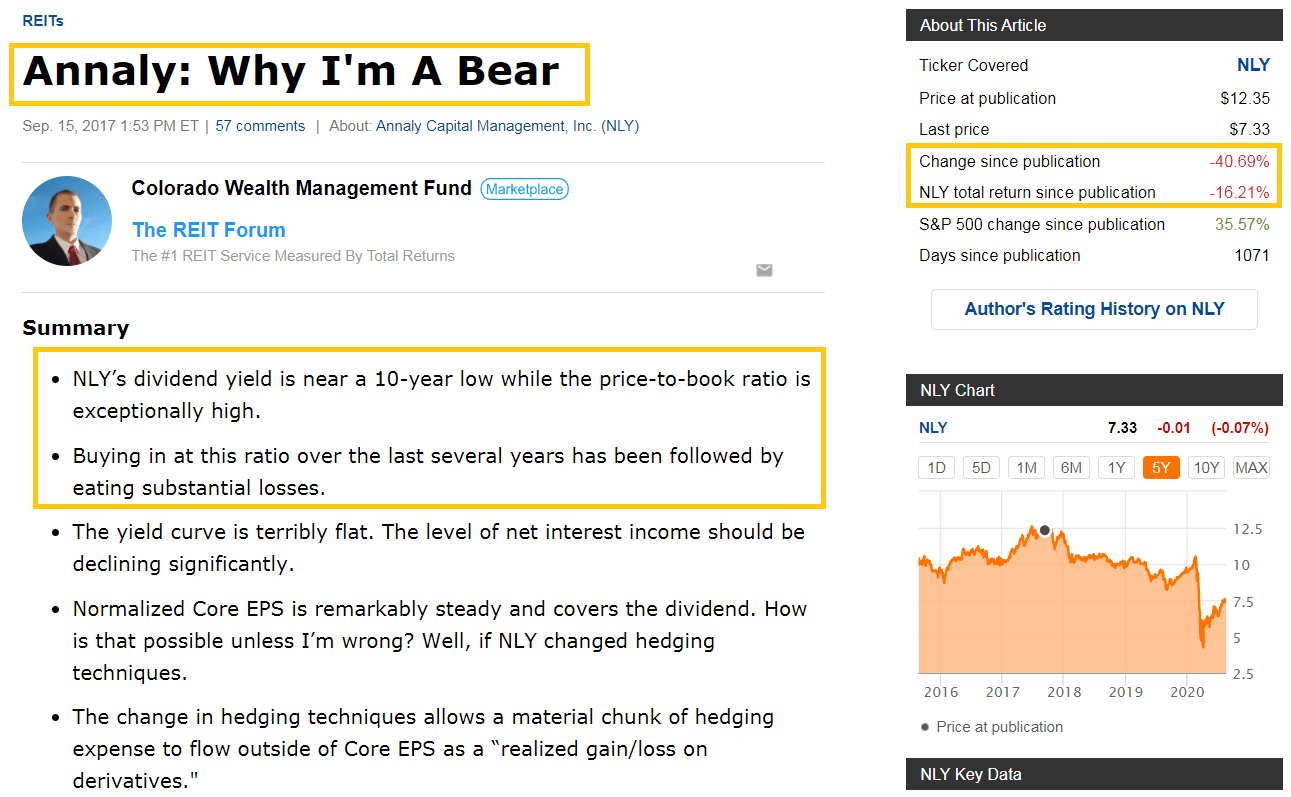
Source: Seeking Alpha
Clearly, it was possible to recognize the high price-to-book ratio in real-time.
So we called out NLY's high valuation in September 2017 and in February 2020, but were we able to recognize the issue in early 2019?
We saw that as well:
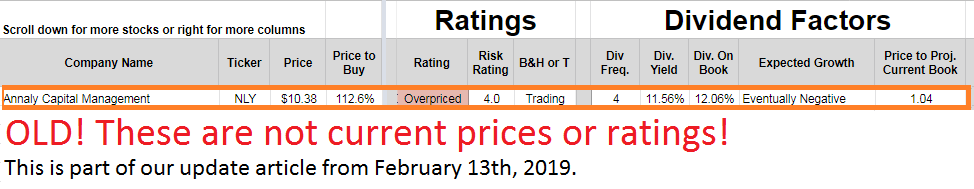
Source: The REIT Forum Mortgage REIT Update (subscription required)
Spreads
When we talk about spreads, investors expect the conversation to be focused exclusively on net interest spreads. While the net interest spread is a fine topic, it isn't the only relevant spread. There are also "spread" measures that refer to MBS.
MBS Spreads
A few mortgage REITs will include slides demonstrating spreads related to MBS. Annaly Capital Management included one in their Q2 earnings presentation:
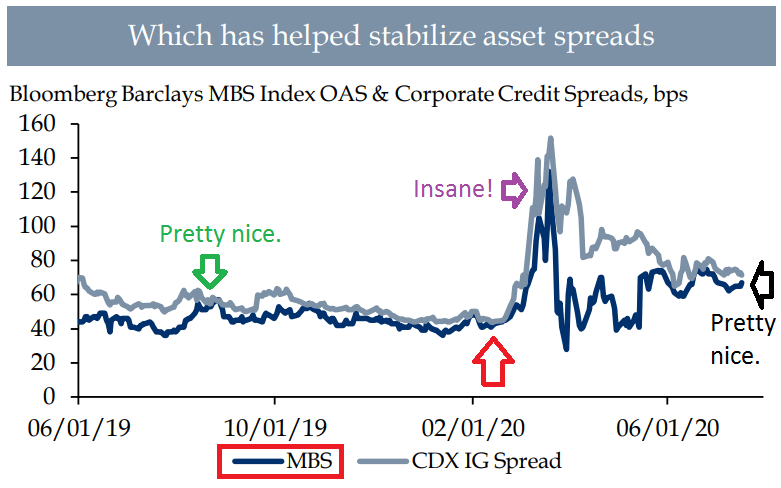
Source: NLY
The dark blue line shows the spreads on MBS. The green arrow shows spread back in early Q3 2019, which was pretty good. When the spreads "widen", the dark blue bar moves higher. We can see there was a little widening in early Q3 2019.
Over the next several months, leading into February 2020, the spreads tightened (the dark blue line went down). When the line goes down (spreads tighten), book value will generally go up. However, if the line goes up, book value will go down.
So what happened in March (see the purple arrow)? The dark blue line soared higher and book value plunged. Share prices were plunging at the same time and reached incredible values in late March and early April.
Implication:
If the spread is already tight, big gains to book value in future periods are unlikely.
Therefore:
If the spread is already tight, you should be extra wary about paying a premium.
Note: Spreads are measured in real-time. In the period where the spread tightens, book value is generally increasing at the exact same time. So a tightening occurring in Q4 2019 would cause book value to increase during Q4 2019, but it would make further increases more difficult. If you're waiting until management reports the Q4 2019 book value, you're months behind the real-time analysis.
Contrast in Spreads
Recent measures (see black arrow) are pretty nice. They are clearly much better than they were in February 2020. Let's put those lessons together:
When the price-to-book ratio is closer to 1.10, poor investment results are more likely.
In February 2020, the price-to-book ratio was getting close to 1.10.
In February 2020, the spreads were already pretty thin.
Therefore, investors were paying a high ratio to get a bad opportunity.
Contrast that to August 2020:
When the price-to-book ratio is closer to 0.80, better investment results are more likely.
In August 2020, the price-to-book ratio is closer to .90.
In August 2020, the spreads were still pretty nice. Not great, but pretty nice.
Therefore, investors are paying a lower ratio to get a better opportunity.
Has This Ever Happened Before?
If you'll measure opportunities over the span of years, then yes it is absurdly common. There's a reason CWMF and Scott Kennedy have been able to earn so much money in mortgage REITs even when the ETF provides poor returns over long periods.
A Sector of Opportunities
Rather than just looking at one or two mortgage REITs, you want to be able to consider a large chunk of the sector. Why? Because two similar mortgage REITs may offer dramatically different valuations. What if the spreads are fairly mediocre? Would you want to buy shares? It would depend on the valuation.
If you only looked at one or two mortgage REITs, it might appear they were cheap or expensive. However, if you can contrast that with other opportunities throughout the sector, you could get a better feel for which opportunities are better than others.
Does that take time? Absolutely. It takes a substantial time investment. Scott puts in the time to stay on top of that so we can identify opportunities where the deck is stacked in our favor. We won't win every single time, but we don't need to win every time. We just need to win the majority.
Recent Performance
Annaly had a solid second quarter:
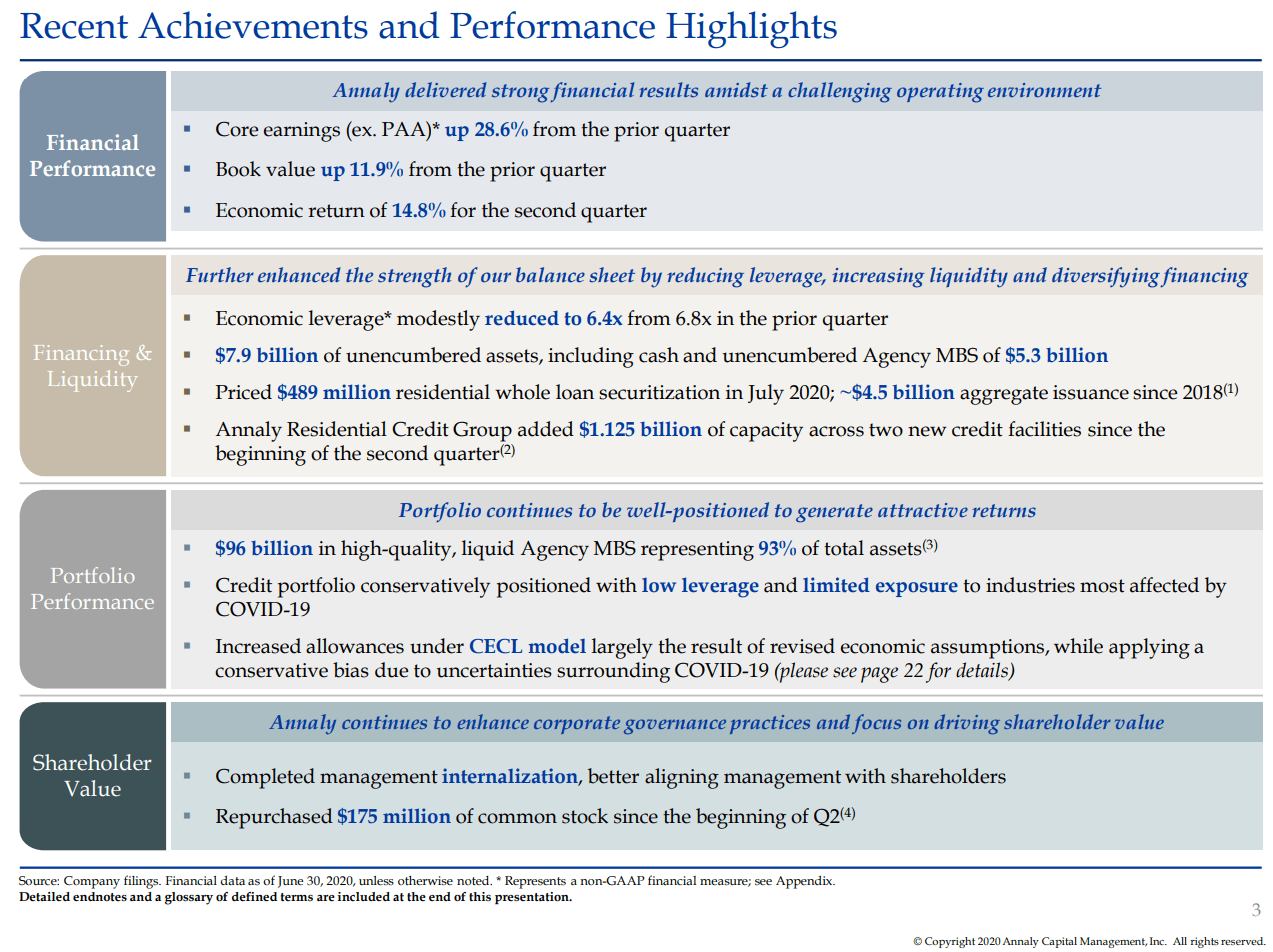
Source: NLY
As spreads tightened, they delivered a massive 11.9% gain to book value per share and a 14.8% economic return for the quarter. They also repurchased some common shares to take advantage of the discount to book value.
Conclusion
Our latest targets and estimates are included on the index card below:
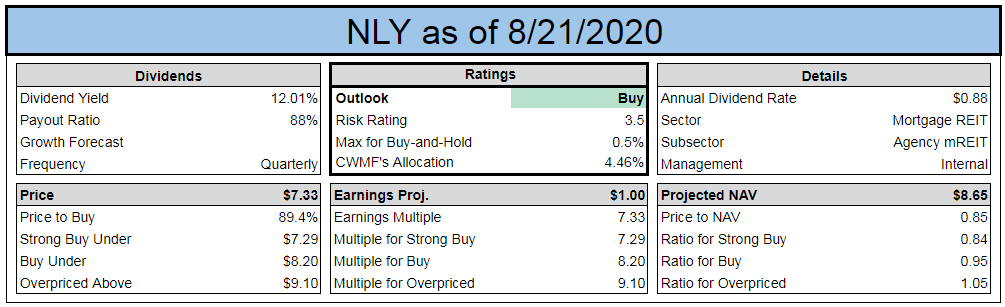
Source: The REIT Forum
Currently, NLY offers one of the better opportunities. It also carries a risk rating of only 3.5, which is very low for a mortgage REIT. Respectable spreads combined with a material discount to current estimated book value create a solid opportunity.
- Bullish Rating on NLY

We are the only large REIT Research service on Seeking Alpha with:
- A CPA on the team.
- A record going back to the start of 2016.
- A real-money portfolio worth over a half-million with full disclosure on every trade.
- Real-time notifications on every purchase and every sale, including exact share count, purchase price, dividends earned, and sale price.
- All of the exclusive research from Colorado Wealth Management Fund and Scott Kennedy.