
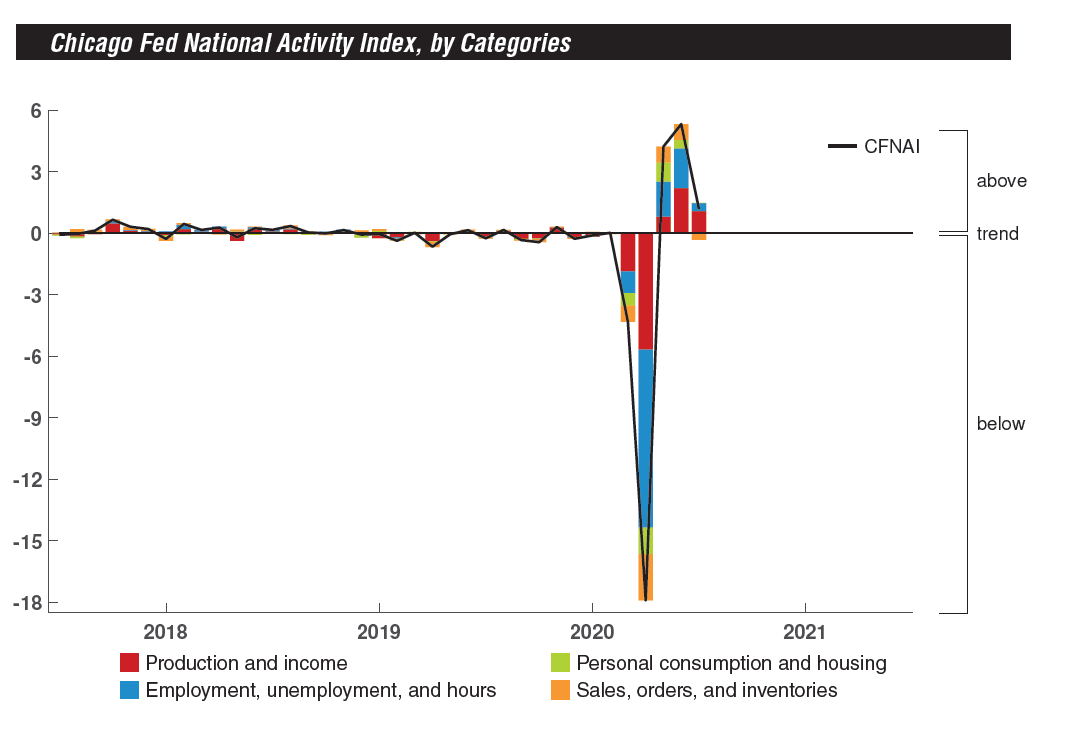
The Chicago Fed's National Activity Index was positive (emphasis added):
Led by some moderation in the growth of production- and employment-related indicators, the Chicago Fed National Activity Index (CFNAI) declined to +1.18 in July from +5.33 in June. Three of the four broad categories of indicators used to construct the index made positive contributions in July, but all four categories decreased from June. The index’s three-month moving average, CFNAI-MA3, rose to +3.59 in July from –2.78 in June.
The CFNAI Diffusion Index, which is also a three-month moving average, moved up to +0.62 in July from +0.14 in June. Fifty-six of the 85 individual indicators made positive contributions to the CFNAI in July, while 29 made negative contributions. Twenty-five indicators improved from June to July, while 60 indicators deteriorated. Of the indicators that improved, nine made negative contributions.
Here's the accompanying chart:
Other coincidental data has started to improve but still has some way to go before re-attaining pre-pandemic levels.
The New York Fed's coincidental data index, while still negative, continues to improve:
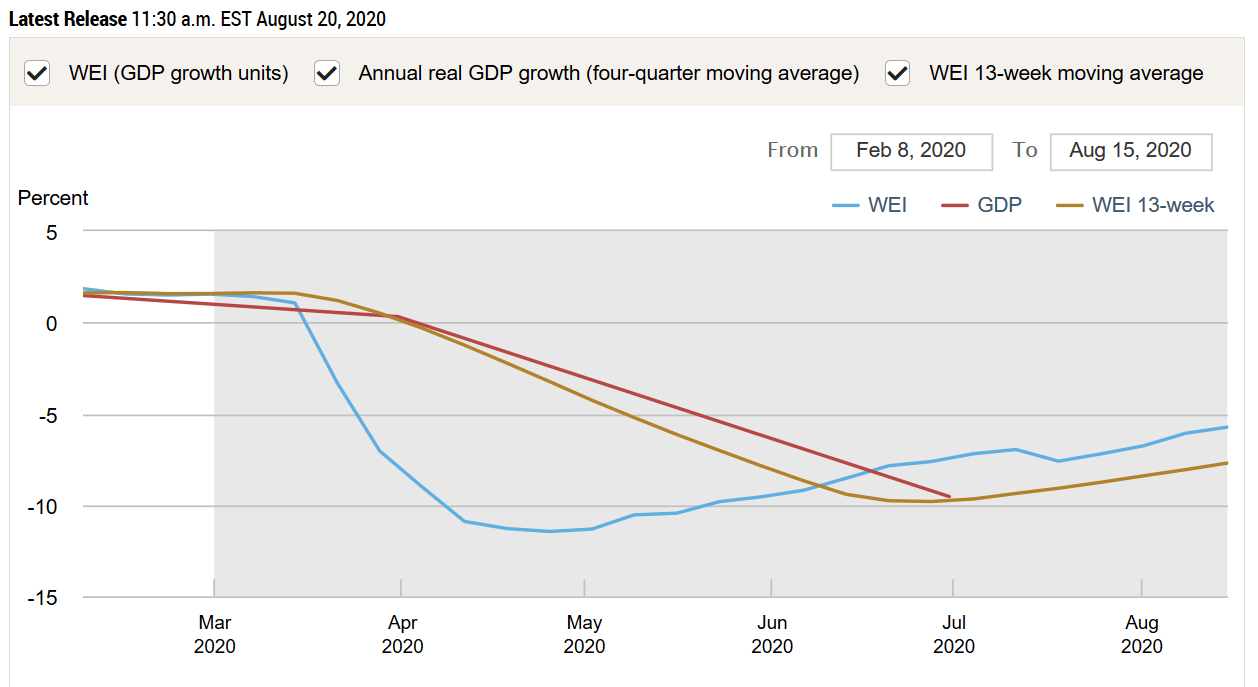
Here's a list of the data used for this index.

Calculated Risk also keeps a running tab of eight other indicators. Like the NY Fed data, the CR data is improving, but still below pre-pandemic levels.
Market breadth data indicates the Nasdaq might be near a reversal point, while the S&P 500 has more upward room: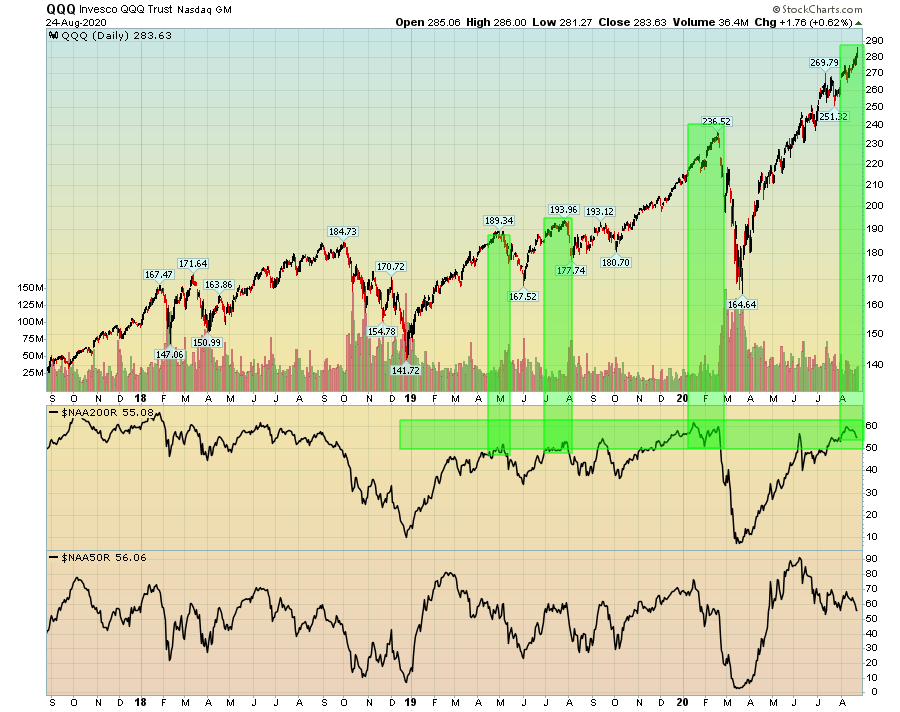
The chart above depicts QQQ along with the percentage of Nasdaq stocks above the 200-day EMA (second panel) and 50-day EMA (third panel). The current percentage of stocks above the 200-day EMA is at the same level as the last three reversals. 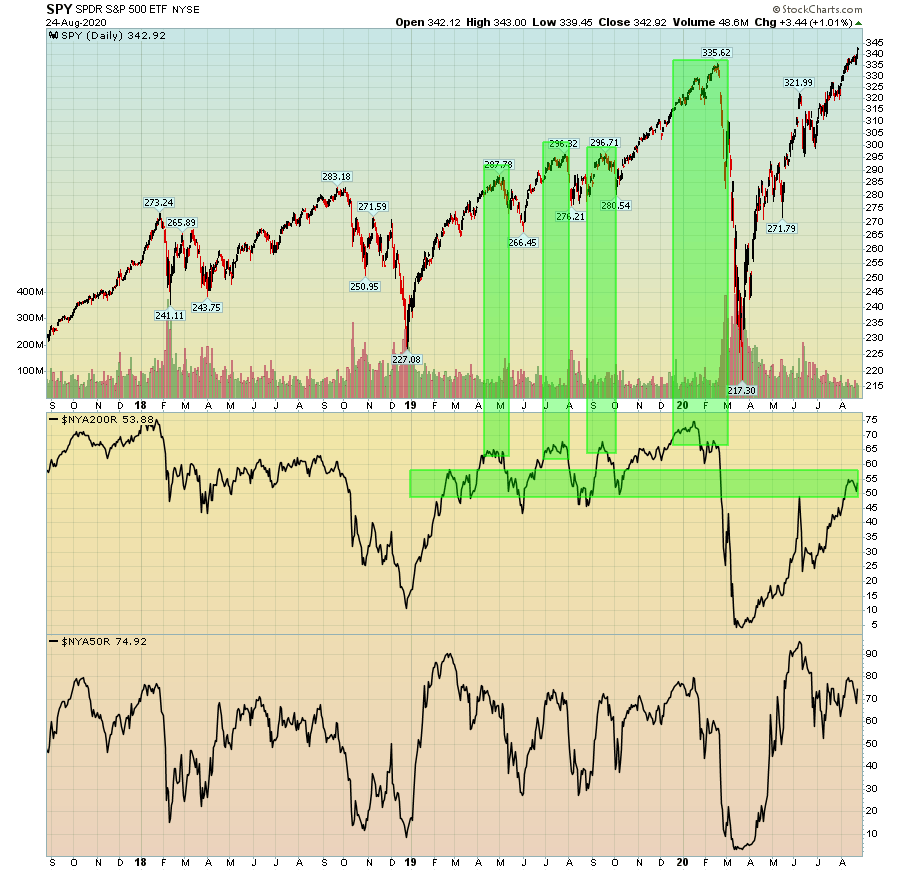
The above chart has the same data, except that it applies to the S&P 500 (as represented by SPY). The percentage of stocks above the 200-day EMA is below levels