 My Friday column has two sections. The first uses the methodology developed by Arthur Burns and Geoffrey Moore that divides economic data into long-leading, leading, and coincidental data to determine the potential economic trajectory. The second analyzes at charts of the ETFs that track the major indexes.
Long-Leading Indicators
There is ample liquidity along with low financial stress:
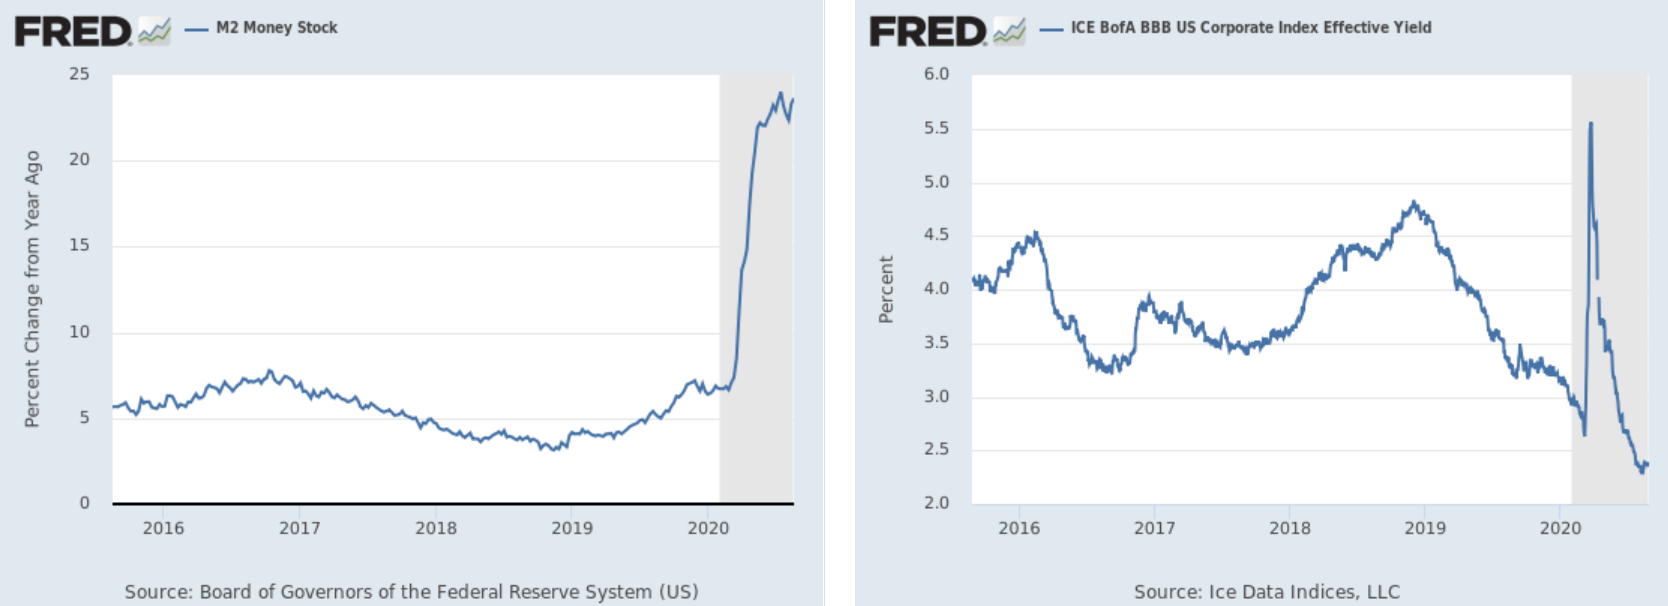 M2 (left chart) is very high while the BBB yield (right chart) is low. Both are the direct result of the Fed's market interventions in response to the Spring lockdowns.
Meanwhile, second-quarter earnings were terrible (emphasis added):
Total earnings for the 484 S&P 500 members that have reported Q2 results already are down -32.3% on -9.5% lower revenues, with 80.4% beating EPS estimates and 64.0% beating revenue estimates.
So far, third quarter earnings are projected to be terrible as well (same link; emphasis added)):
For 2020 Q3, total S&P 500 earnings are expected to decline -23.9% on -3.2% lower revenues. This is an improvement from the -26.5% earnings decline expected at the start of July.
Leading Indicators
Most of the leading indicators are positive.
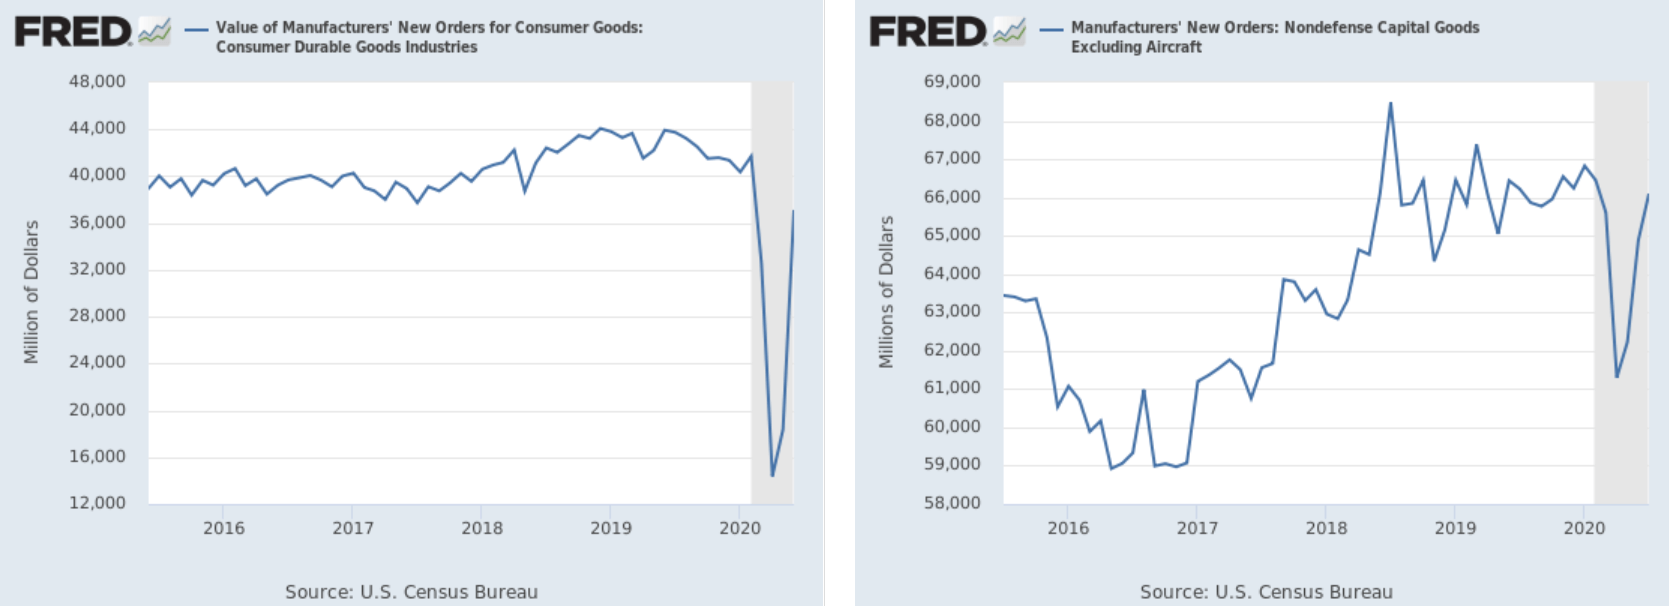 New orders for consumer durable goods (left) and non-defense capital goods (right) are rising. The former is just shy of pre-pandemic levels while the latter has reattained previous levels.
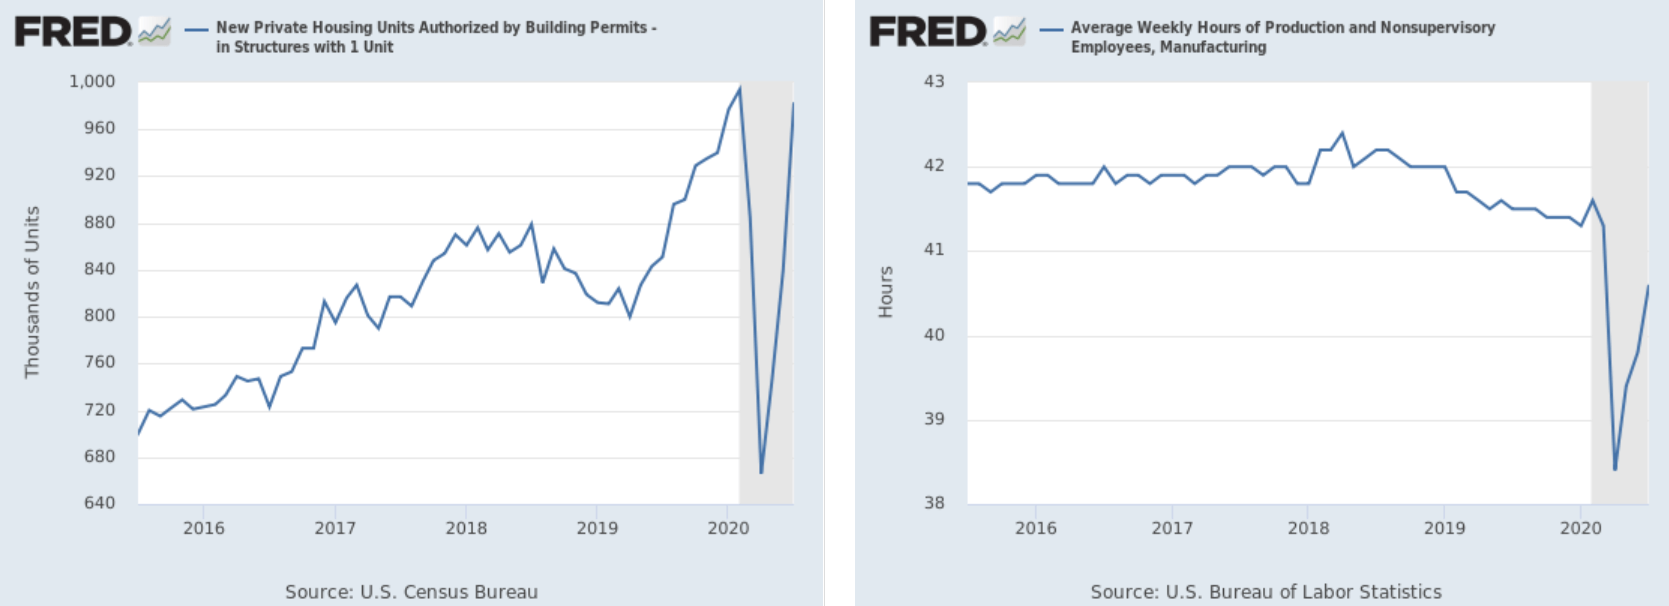 Building permits (left) are back at very high levels while weekly hours of production workers (right) are climbing from lockdown levels.
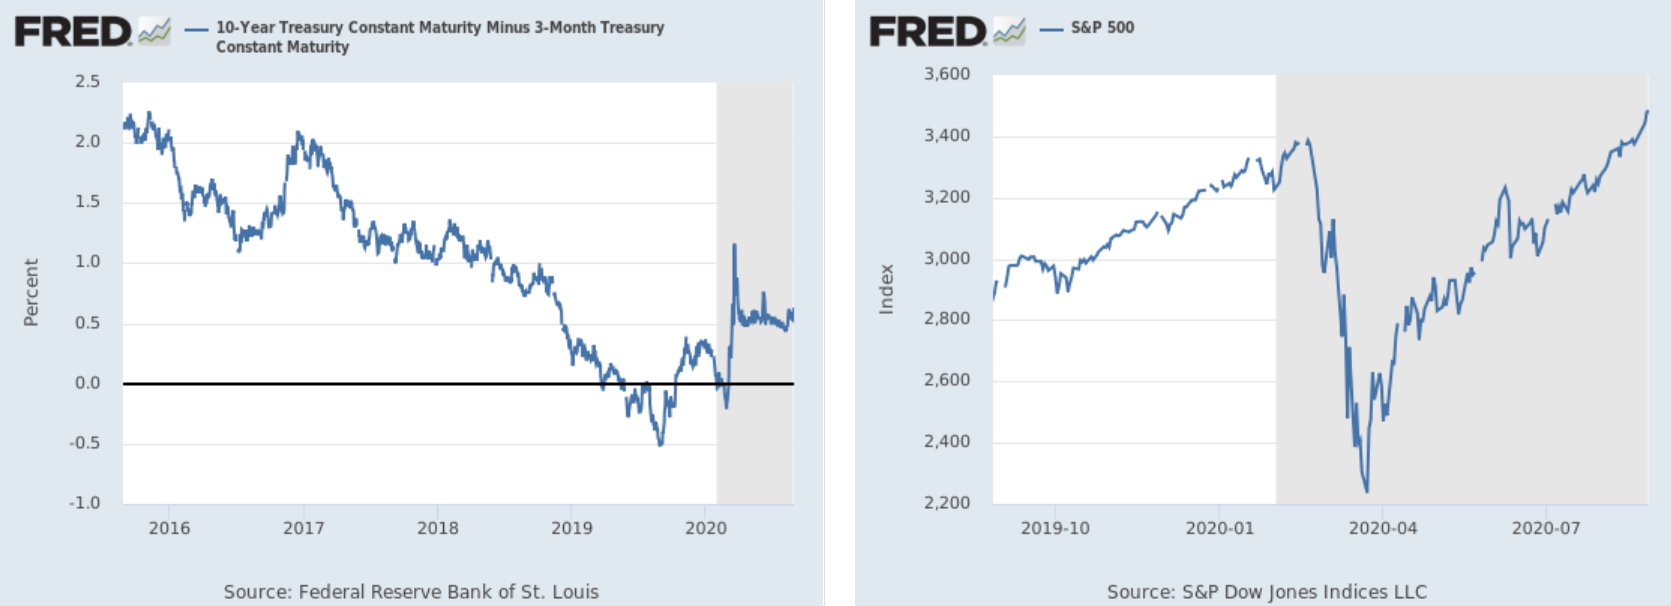 The yield curve (left) is no longer inverted (which is expansionary) while the stock market (right) is hitting record highs.
However, there is still one big "fly in the ointment:"
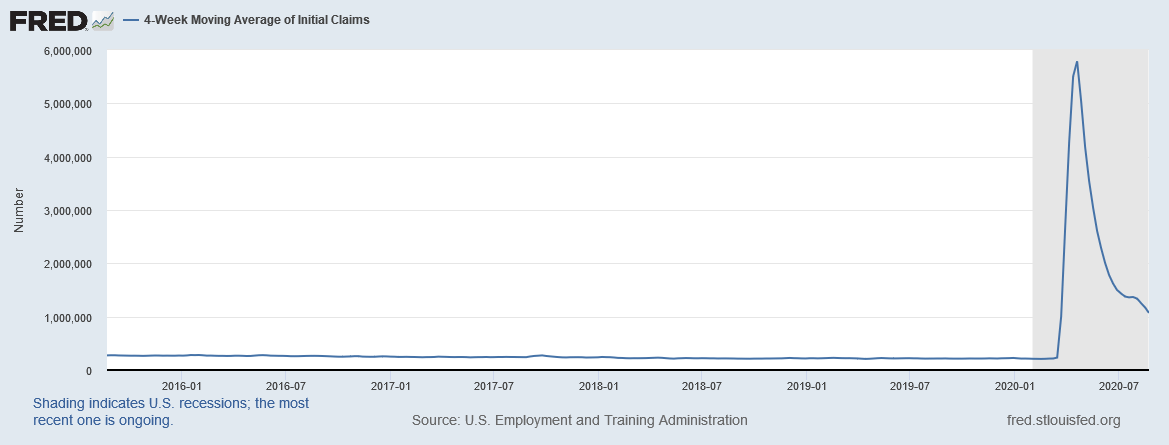 The labor market is in shambles. The 4-week moving average of initial unemployment claims is still above 1,000,000, indicating that a record number of people are entering the unemployment ranks every week.
Coincidental data
The BEA released the second estimate