Science Applications International: No Security Clearance Needed To Buy Shares In DoD Supplier

Michael Fitzsimmons
22.01K Followers

Summary

  • The company is a big supplier of the U.S. Department of Defense ("DoD") as well as intelligence and federal agencies.
  • Revenue, earnings, and free cash flow have been unspectacular but growing steadily. Current backlog is a whopping ~2.7x TTM revenue.
  • In a market full of arguably overpriced stocks, SAIC trades at less than half the P/E of the S&P 500 and yields 1.9%.
  • Based on earnings and a P/E=15, the stock could easily trade up to $95/share over the next year, offering a ~25% return.

Science Applications International (NASDAQ:SAIC) provides engineering, technical, and enterprise IT solutions to the U.S. government. The company has over 25,000 employees, about half of which have security clearances (slide 5). That's because almost 50% of revenue comes from the Department of Defense ("DoD"), and several recent large-scale contract wins are exhibits #1 and #2 (see below). The company is significantly undervalued in comparison with the S&P 500, and could be a prime beneficiary of a rotation out of high-flying tech stocks into more boring undervalued companies.

Earnings

SAIC's fiscal year is one full year ahead of the calendar year. As a result, SAIC released its Q2FY21 earnings report on September 2nd:

Source: Q2 EPS report

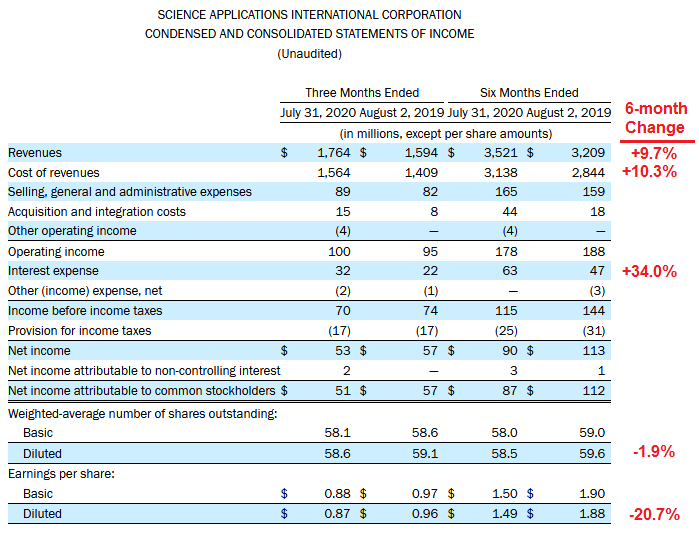
In spite of top-line revenue growth of nearly 10% over the first six months of the year versus the year earlier period, cost-of-revenues increased at a faster pace and combined with higher SG&A, expenses related to the Unisys (UIS) Federal acquisition, and higher interest expense (+34%) EPS fell 20.7% as compared to the first six months of 2019.

During the quarter, SAIC voluntarily paid down $125 million of debt. Subsequent to the end of the quarter, SAIC has made another $100 million in voluntary debt repayment and continues to de-lever, which should lead to a meaningful lowering of the $63 million of interest expense during Q2. Long-term debt of $2.7 billion was up ~$800 million over the prior year quarter. Net debt of ~$2.5 on annualized 6-month trailing EBITDA (~520 million) gives a net debt to EBITDA ratio of an estimated 4.8x.

Source: Q2 Presentation

As shown in the graphic above, SAIC delivered $90 million in FCF, or an estimated $1.54/share. Considering the quarterly dividend is only $0.37/share, there appears to be a big disconnect in the company's FCF generation and the amount it chooses to allocate to shareholders. But the disconnect is

This article was written by

22.01K Followers
Michael Fitzsimmons is a retired electronics engineer and avid investor. He advises investors to construct a well-diversified portfolio built on a core foundation of a high-quality low-cost S&P500 fund. For investors who can tolerate short-term risks, he advises an over-weight position in the technology sector, which he believes is still in the early stages of a long-term secular bull-market. For dividend income, and as a 4th generation oil & gas man, Fitzsimmons suggests investors consider a position in large O&G companies that provide strong dividend income and dividend growth. Fitzsimmons' articles on portfolio management recommend a top-down capital allocation approach that is aligned with each individual investor's personal situation (i.e. age, retired/working, risk tolerance, income, net worth, goals, etc) and might include allocations into investment categories such as the S&P500, technology, dividend income, sector ETFs, growth, speculative growth, gold, and cash.

Analyst’s Disclosure:I/we have no positions in any stocks mentioned, and no plans to initiate any positions within the next 72 hours. I wrote this article myself, and it expresses my own opinions. I am not receiving compensation for it (other than from Seeking Alpha). I have no business relationship with any company whose stock is mentioned in this article.

I am an engineer, not a CFA. The information and data presented in this article were obtained from company documents and/or sources believed to be reliable, but have not been independently verified. Therefore, the author cannot guarantee their accuracy. Please do your own research and contact a qualified investment advisor. I am not responsible for the investment decisions you make.

Seeking Alpha's Disclosure: Past performance is no guarantee of future results. No recommendation or advice is being given as to whether any investment is suitable for a particular investor. Any views or opinions expressed above may not reflect those of Seeking Alpha as a whole. Seeking Alpha is not a licensed securities dealer, broker or US investment adviser or investment bank. Our analysts are third party authors that include both professional investors and individual investors who may not be licensed or certified by any institute or regulatory body.

Recommended For You

About SAIC Stock

SymbolLast Price% Chg
Market Cap
PE
Yield
Rev Growth (YoY)
Short Interest
Prev. Close
Compare to Peers

More on SAIC

Related Stocks

SymbolLast Price% Chg
SAIC
--