Global X Super Dividend REIT ETF: A Different Asset Allocation Model

Chetan Woodun
8.46K Followers

Summary

  • The SRET has a history of underperformance and volatility.
  • It is trading at nearly 50% below its yearly high.
  • The ETF's above-average exposure to mortgage REITs is now history.
  • A peer comparison helps to highlight some of the unique features of SRET.
  • At current prices, SRET is a buy for income seekers.

The Global X Super Dividend REIT ETF (NASDAQ:SRET) is composed of about thirty of the highest yielding REITs, mostly in the US. The ETF makes distributions on a monthly basis, providing a regular source of income shareholders.

Figure 1: Share price and total return evolution

Chart

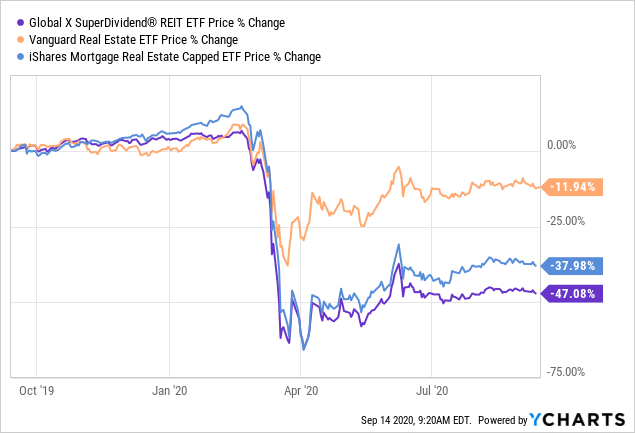
While the Vanguard Real Estate ETF (VNQ) which I covered last week has recovered to a large extent from the end-of-February market crash and is now only at 12% below its one-year high, this is far from being the case with SRET.

However, with past underperformance not always being an indicator for future underperformance and considering the fact that the asset allocation for the underlying fund is dynamic, I take a fresh look at SRET.

First, I consider the very reason why people invest in an ETF, that is for diversification purposes and also what this means in terms of concentration risks.

Diversification

SRET's strategy is to screen REITs at a global level and make a shortlist of the 60 paying the highest dividend yield. Then, out of these, it selects 30 of the least-volatile ones.

This means that the underlying fund regularly updates asset allocation.

Now exploring the September 14 industry breakdown, the concentration of mortgage REITs which was at a staggering 57% in early June has now been significantly reduced to just under 40%. Also, Hotel and Resorts, which made up 10.32% of the portfolio previously now make up for just under 3%.

Figure 2: SRET by industry breakdown for June 03 and September 14.

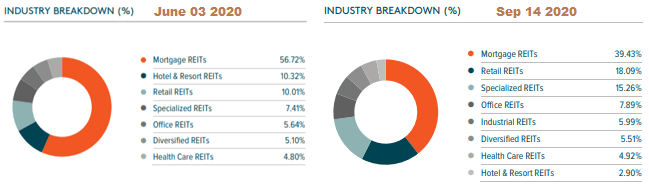
Source: Industry breakdown for June 03 and September 14.

Also, the percentage allocation to specialized properties is now 15% from 7% only three months back. Some of the specialized REITs include big names like Iron Mountain (IRM) and Gaming and Leisure Properties (GLPI) which through

This article was written by

8.46K Followers
As a tech-focused industry Research Analyst, I aim to provide differentiated insights, whether it is for investing, trading, or informational reasons. For this purpose, I am not a classical equity researcher from the financial sector, but, I come from the IT world as the Director of Keylogin InfoTech and my insights are based on my own experience investing for 25 years.Also, my research is often backed by analytics and I make frequent use of charts to support my position.Based on losses during the GFC, I am often moderate and focus more on the direction and look for strategies to preserve capital. As per my career history below, I have wide experience, initially as an implementer in virtualization and cloud, and I was subsequently a team leader and project lead, mostly working in telcos.I like to write around themes like automated supply chains, Generative AI, telcos Capex, the deflationary nature of software, semiconductors, etc. and I am often contrarian. I also cover biotechs with more of a "techbio" focus.I have also been an entrepreneur in real estate ( a mediocre one), a business owner, and a farmer, and dedicate at least 5 hours per week to working on a non-profit basis. For this purpose, I help needy families by providing sponsored work and contributing peer reviews and opinions for enterprise tech.My investment journey started in mutual and indexed funds before later opting for individual stocks. Got a lot of experience in the 2008/2009 crash when I lost a lot due mostly to wrong advice. Since then I have done my research and have fallen in love with Seeking Alpha because of the unique perspectives it provides to someone investing hard-earned money as well as access to some of the best analysts.

Analyst’s Disclosure:I am/we are long INN. I wrote this article myself, and it expresses my own opinions. I am not receiving compensation for it (other than from Seeking Alpha). I have no business relationship with any company whose stock is mentioned in this article.

This is an investment thesis and is intended for informational purposes. Investors are kindly requested to do additional research before investing. I may initiate a long position in SRET over the next 72 hours.

Seeking Alpha's Disclosure: Past performance is no guarantee of future results. No recommendation or advice is being given as to whether any investment is suitable for a particular investor. Any views or opinions expressed above may not reflect those of Seeking Alpha as a whole. Seeking Alpha is not a licensed securities dealer, broker or US investment adviser or investment bank. Our analysts are third party authors that include both professional investors and individual investors who may not be licensed or certified by any institute or regulatory body.

Recommended For You

About SRET ETF

SymbolLast Price% Chg
Expense Ratio
Div Frequency
Div Rate
Yield
Assets (AUM)
Compare to Peers

More on SRET

Related Stocks

SymbolLast Price% Chg
SRET
--