Recently we've seen more requests for educational articles. We enjoy preparing some educational articles and are happy to help readers understand their investments better. Even if investors think they understand FFO multiples, at least some of the content here will help expand their understanding. We will start with a few basics, then jump into the more complex topics.
This article is going to focus on FFO multiples and AFFO multiples. We will demonstrate how differences in leverage can warrant significant differences in multiples. This is part of why small equity REITs consistently trade at lower multiples. When you understand these topics, you'll want to see our report on the shortcomings of small over-leveraged equity REITs: Why My REITs Beat Your REITs
Since this article is going to deal with "FFO" metrics, we need to highlight that this article applies ONLY to equity REITs. It should not be used at all in evaluating mortgage REITs. While both are REITs, they are dramatically different in their operations.
What Are FFO Multiples?
Divide the share price by FFO per share and you get the FFO multiple.
For instance, if the share price is $80.00 and the estimate is for $4.00 in FFO per share, the FFO multiple is 20x.
What Do You Use For FFO Multiples?
You could use the trailing FFO per share or use the consensus analyst estimate. Neither method is going to be perfect. We tend to use consensus analyst estimates, but we need to stress that these are still far from perfect.
What Are The Flaws In Using FFO multiples?
There are a few weaknesses to consider here.
- If you're using NAREIT FFO per share (or forward estimates for NAREIT FFO) you may have substantial impacts from non-recurring expenses.
- You can adjust for the non-recurring expenses by using "recurring FFO per share", but forward estimates are more difficult to find for "recurring FFO per share". Further, some non-recurring factors won't be adjusted. Note: "Recurring FFO" and "AFFO" are not equivalent.
- FFO per share can be inflated by REITs employing more leverage or buying poor quality properties. Either can drive a massive change in the value. For example, if a REIT sells industrial properties and uses the cash to buy malls, the FFO per share will rocket higher in the short term because they are selling higher-quality to buy lower-quality.
- FFO per share excludes the impact of recurring capital expenses to maintain the portfolio. Using "Analyst AFFO" per share will solve that aspect, but many REITs report their own value for "AFFO" that doesn't match "Analyst AFFO".
FFO
Why would anyone still use it as a metric?
Most equity REITs will report NAREIT FFO per share and may report something similar to a "Recurring FFO" per share metric. The ubiquity of the metric helps it catch on.
What Does Analyst AFFO Solve?
At The REIT Forum, we often prefer to use "Analyst AFFO" estimates. These still aren't perfect, but they improve the comparability. With Analyst AFFO metrics the analysts all know to remove non-recurring expenses.
That makes it superior to using FFO per share. However, we still have to caution that analysts don't agree on calculation. Some analysts add back stock-based compensation and some don't. Consequently, the "estimates" won't be the same.
The recurring capital expenditures can be a bit of a challenge as well. Should the estimate use an estimate of long-term necessary recurring capital expenditures, or should they estimate based on the amount they expect to actually be spent in that year?
Recurring Capital Expenditures
If we knew a REIT's apartment buildings had 30-year roofs on average, we could assume they would need to replace 3.3% per year. That would be pretty reasonable. However, we might also hear that the REIT intends to replace 0 roofs this year and 10% of roofs next year. Should our AFFO estimates use our estimated recurring value (reflecting about 3.3%), or should we model for $0 in roof replacement this year and a huge value next year?
You're welcome to pick either answer. Whichever one you pick, some analysts will agree and others will disagree.
When we evaluate the long-term viability of the REIT, we tend to incorporate our estimates of long-term values.
Why?
Because poor-quality REITs may defer maintenance or attempt to reclassify their recurring capital expenditures as "development". The information an analyst needs to definitively prove these activities is not available across any of the financial statements.
This is a reason many investors may get suckered into low-quality REITs. You won't see that mistake in The REIT Forum. We focus on evaluating stronger REITs.
The Leverage Impact
Let's start with two simplified equity REITs:
- Debt-Free REIT
- High-Debt REIT
We're going to include a few assumptions to simplify them:
- Each REIT buys properties at a 5% cap rate.
- The management works for free to simplify the math.
- Each REIT trades at precisely the net value of their assets and the net asset value is $100.00.
- Each REIT spends 100% of their capital on buying properties, so there is no "excess" capital to include.
- The Debt-Free REIT uses $0 in debt. The High-Debt REIT finances 50% of their portfolio value with debt at a 3.5% interest rate and 50% in with equity.
- Each REIT needs to spend 20% of the NOI on recurring capital expenditures.
The Debt-Free REIT
Debt-Free REIT owns $100.00 of property.
NOI is $5.00. The Overhead is $0.00 and interest is $0.00. Therefore, the FFO is $5.00. Recurring capital expenditures is $1.00. This REIT has $4.00 available for shareholders (matching Analyst AFFO).
Since FFO per share is $5.00 and the stock costs $100.00, they trade at 20x FFO.
Since Analyst AFFO per share is $4.00 and the stock costs $100.00, they trade at 25X Analyst AFFO.
They have no debt, so even if their sector gets hit in a recession, they gradually recover.
The High-Debt REIT
High-Debt REIT owns $200.00 of property.
NOI is $10.00. The Overhead is $0.00 and interest is $3.50. Therefore, the FFO is $6.50. Recurring capital expenditures is $2.00. This REIT has $4.50 available for shareholders (matching Analyst AFFO).
Since FFO per share is $6.50 and the stock costs $100.00, they trade at 15.38x FFO.
Since Analyst AFFO per share is $4.50 and the stock costs $100.00, they trade at 22.22x Analyst AFFO.
They have high debt, so if their sector gets hit in a recession, they may be forced to sell properties at low values and permanently reduce shareholder wealth.
When you hear about a portfolio of REITs trading at much lower multiples of FFO, this is the ugly truth. The low multiple of FFO reflects a weaker stock.
Which REIT Appeals to Amateurs?
New investors will overwhelmingly pick the high-debt REIT. They see the higher FFO per share and think the lower FFO multiple is a bargain. We see the higher debt and don't want to invest in the high-debt REIT.
Which REIT has a greater incentive to cut corners on maintenance capital expenditures? It's High-Debt REIT. If they can convince analysts that they only need to spend 10% of NOI (rather than 20%) on recurring capital expenditures, it boosts "Analyst AFFO" estimates by $1.00. That's 10% of the $10.00 in NOI.
For Debt-Free REIT, convincing analysts that only 10% of NOI is needed for recurring capital expenditures would only boost Analyst AFFO by $.50. That's 10% of the $5.00 in NOI.
We like to see an equity REIT funding less than 30% of their total portfolio with debt. Anywhere around 20% would be great. Amateur investors are more likely to choose REITs where debt plus preferred equity runs in the 35% to 90% range.
The Growth Premium
REITs that consistently grow FFO per share demand a premium valuation. That's reasonable since investors are getting the growth. However, the spread between REITs where growth is expected to be high and REITs with lower growth rates reached a massive difference. There are three subsectors within REITs that have the best positioning for growth:
- Cell Towers
- Data Centers
- Industrial
Note: The order between Cell Towers and Data Centers is debatable.
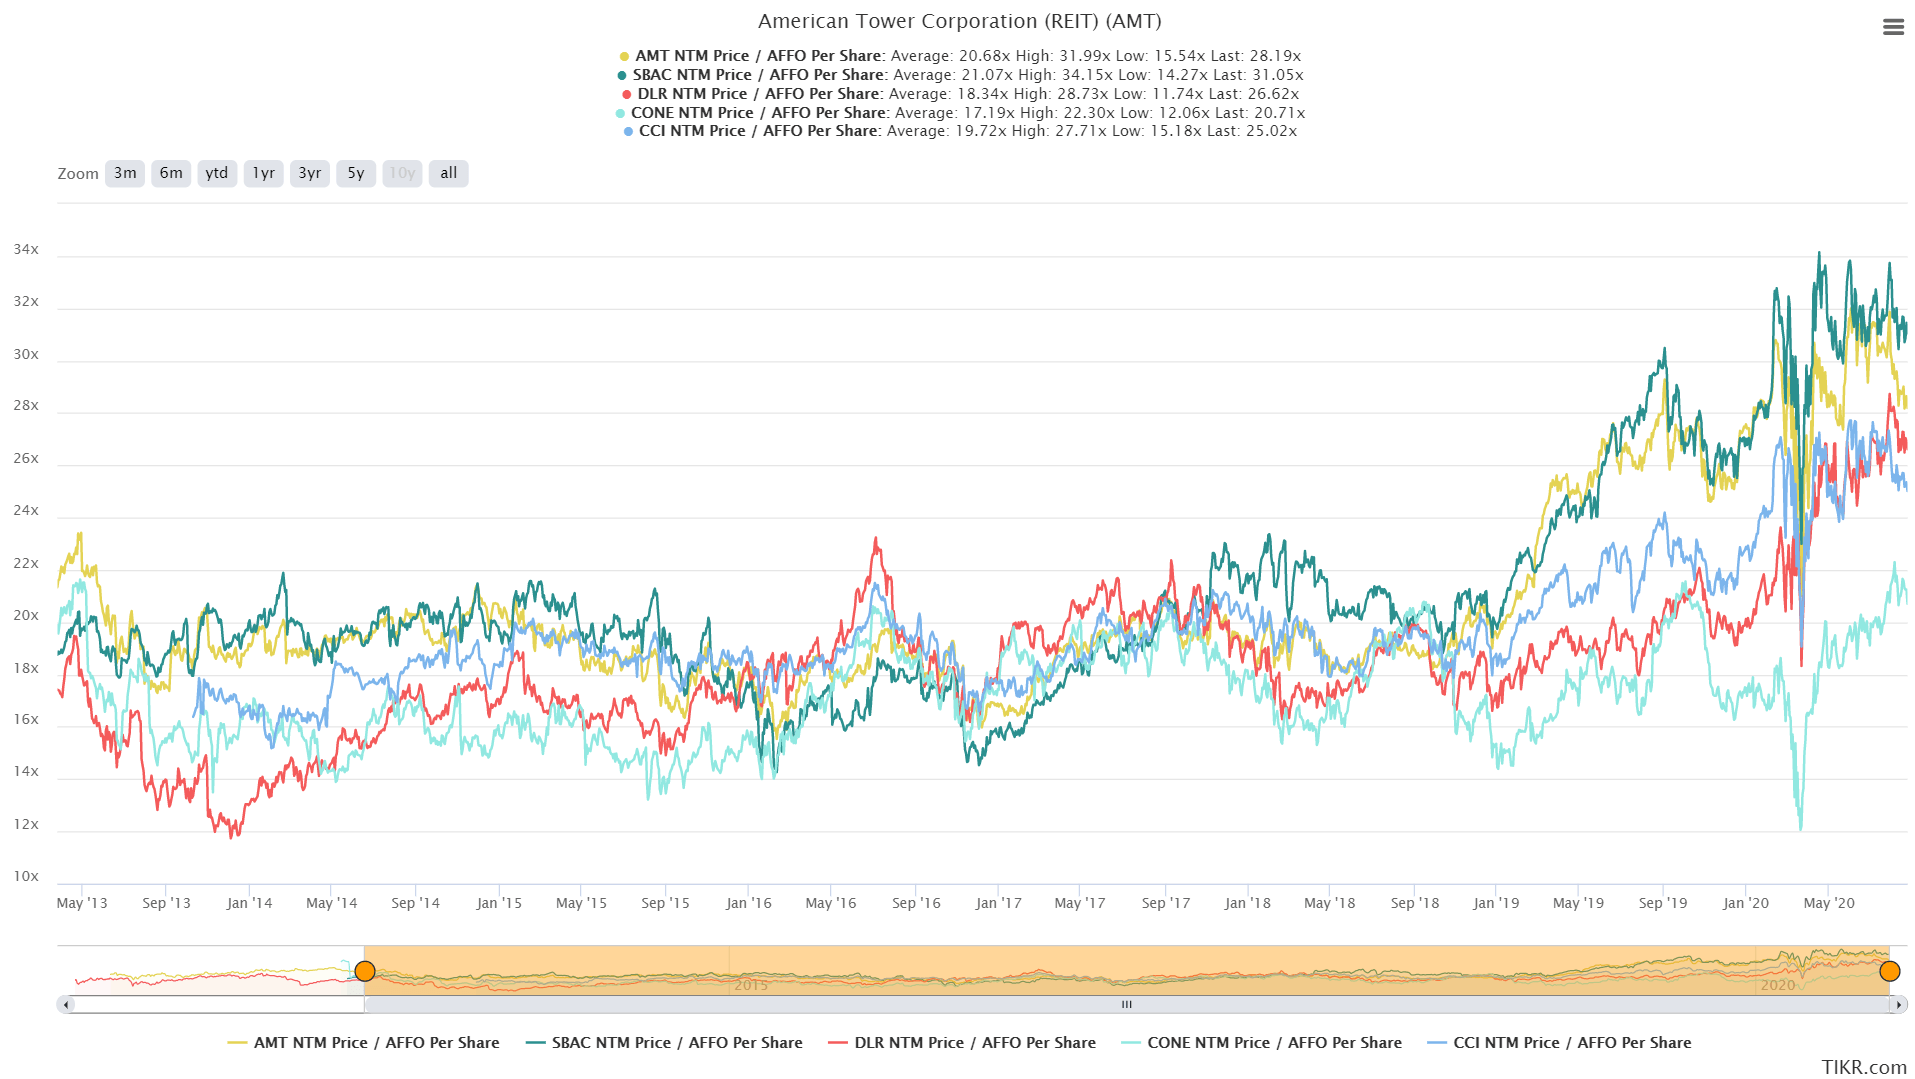
These are clearly the best-positioned subsectors to deliver growth in FFO per share from the 2019 values to the future 2022 values. However, many of the stocks are becoming painfully expensive. That leaves investors to determine how much of a growth premium they are willing to pay. We pulled a chart using "Price to AFFO per share". For "AFFO", we're using the consensus estimate for the next 4 quarters:
Source: TIKR.com
The chart is using the 3 major cell tower REITs and 2 of the major data center REITs. While these REITs have delivered remarkable growth in FFO per share and AFFO per share over the last several years, investors are paying up for the expectation that this growth remains at a very high level. The current multiples on AFFO per share:
- American Tower (AMT) (Cell Tower) 28.19x
- SBA Communications (SBAC) (Cell Tower) 31.05x
- Crown Castle (CCI) (Cell Tower) 25.02x
- Digital Realty (DLR) (Data Center) 26.62x
- CyrusOne (CONE) (Data Center) 20.71x
Higher AFFO multiples can be justified with two arguments:
- Since growth is higher and will (hopefully) remain higher, a premium valuation is deserved.
- Since bond yields have plunged, REITs should trade at a higher multiple of AFFO.
There is a viable argument for each of those points. However, the reason we haven't purchased shares in the cell tower REITs yet is the high multiple. The fundamentals for growth in the sector are extremely attractive, so at the right price, they could be great for a buy-and-hold position as part of the portfolio.
Let's touch on the bond yield concept for a moment. We can highlight that bond yields in 2016 were very low. Yet multiples in 2016 were dramatically lower, even though the next few years would include absolutely incredible growth rates. Therefore, we can say that bond yields are clearly only one part of the equation.
The Way Valuations Swing
When that growth story is called into question, the multiples can plunge dramatically. We can demonstrate that using the housing REIT subsector. Returns across the sector went in dramatically different directions because of a swing in the multiples:
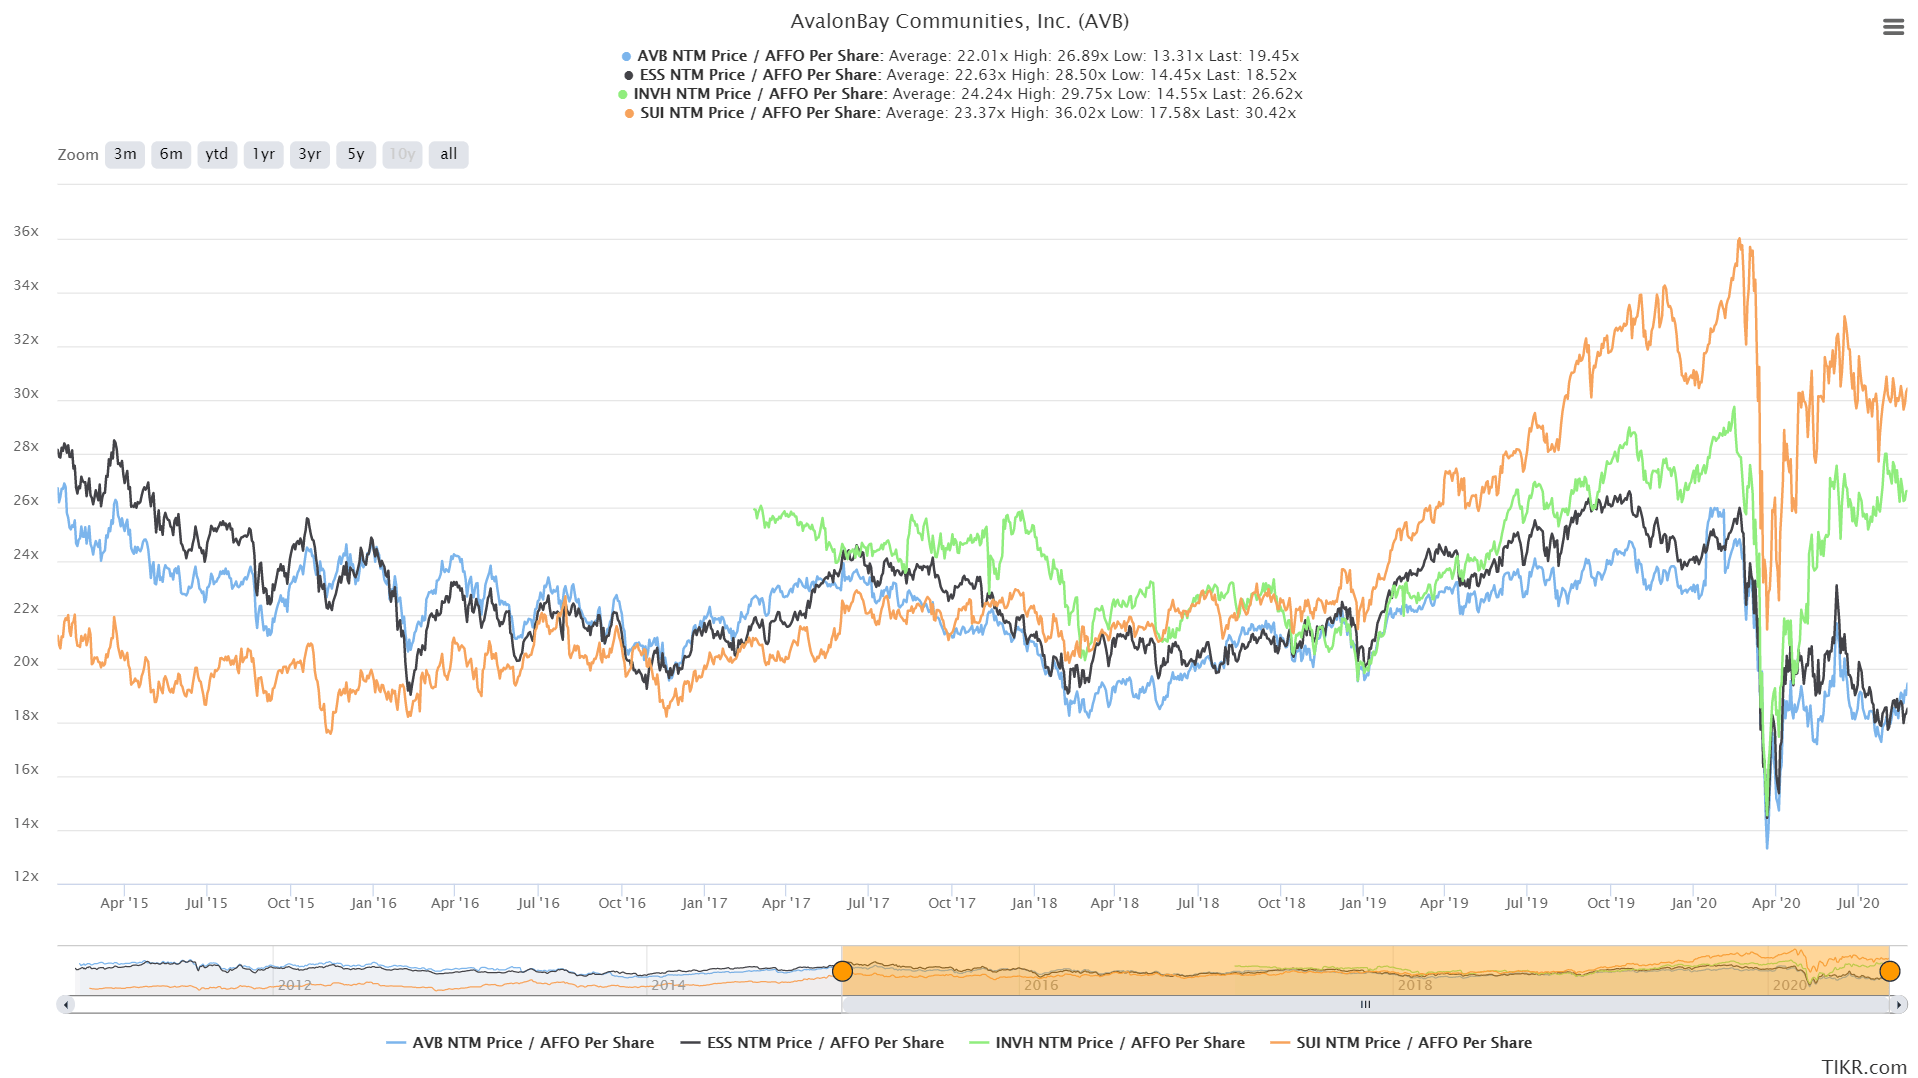
Source: TIKR.com
The REITs we're including are:
- AvalonBay (AVB) 19.45x (Apartments)
- Essex Property Trust (ESS) 18.52x (Apartments)
- Invitation Homes (INVH) 26.62x (Single-Family rentals)
- Sun Communities (SUI) 30.42x (MH Park)
So far, the ability to grow AFFO per share hasn't been so wildly different. Sun Communities beat out other kinds of REITs in AFFO per share growth, but you can also see a dramatic swing over the last several years in the AFFO multiples.
Note: At The REIT Forum, our largest equity REIT position is SUI because we bought hard on dips and intended to hold indefinitely. Our second-largest equity REIT position is ESS.
Our most recent seven purchases in equity REITs were W. P. Carey (WPC), Equity Residential (EQR) twice, AvalonBay once, and ESS three times. Aside from W. P. Carey, the other REITs are apartment REITs.
Investors are banking on a dramatic difference in future growth rates to justify the massive swing in the multiples. While apartments are in a tough position at the moment, we don't believe their future growth (a few years out) will be low enough to warrant this change. Consequently, we've bought the apartment REITs a few times over the last two months.
Regarding those growth rates, if INVH grows AFFO per share by 8% per year from 2019 to 2021 years and ESS grows AFFO per share by 0% on average for those years (down in 2020 with a modest recovery in late 2021), that wouldn't be a big enough difference to justify the price. INVH would need to continue growing faster for several years.
If they both began growing at 5% per year in 2022 and onwards, INVH wouldn't deserve the premium valuation. While single-family REITs are positioned better for short-term growth, we don't foresee their rental rates rising faster than apartments forever.
Some investors might think that the difference in multiples reflects a dramatic difference in the balance sheets. If the apartment REITs were simply using far too much debt to finance their portfolios, that would be a simple explanation. However, they are not. The major apartment REITs we are tracking are careful with their balance sheets and don't take on that level of debt.
Conclusion
When you're looking for equity REITs, you should put an emphasis on REITs with lower debt levels. They will often carry a higher FFO multiple, but a higher multiple is warranted because of the difference in financing. While we've been willing to pay higher multiples to get better REITs, we've also held back lately as multiples in some sectors soared dramatically beyond prior highs.
In some cases, valuations within a sector diverged significantly as investors bet overwhelmingly on specific property types. We want to keep an eye on future growth, but we don't want that analysis to be overwhelmed by what happens in one or two years. One example of this divergence is in the single-family home REITs compared to the apartment REITs. Near-term growth for the single-family REITs looks much better, but it is far more difficult to make a long-term case for single-family rents rising indefinitely at a faster rate than apartments.
Want the best research? It’s time to raise your game. Get access to several features you won’t find on the public side.
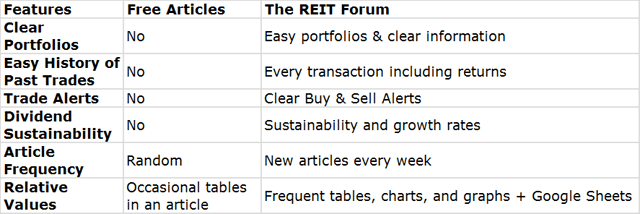
You can get access to everything we have to offer right now. Try our service and decide for yourself.