Introduction
I worked in the investment industry with experience at an investment firm (Primerica, Inc. before the spin-off from Citigroup) for a couple years; got job offers to work as a broker at many other entities, but ended up where I am today; working for a research oriented agency with a special niche in the freight industry.
I formerly have written on Seeking Alpha with specific coverage of the various freight industries in the Transport Sector. Today, I am shifting gears to focus on portfolio management, specifically oriented towards aggressive growth opportunities.
Data and analysis have been well ingrained into my project management responsibilities over the past decade. This has been an excellent fit with my strong interest in deconstructing industries and analyzing companies, something I have done since 2010.
From 2010, I spent two straight years developing strategies to begin developing and building equity-based portfolios. By 2012, I had a good enough approach in place to start my first portfolio, and I have continued to refine the structure and management process over the years.
My investment performance can be characterized in two stages - 2012 through 2017, and 2018 to current.
- During the first stage, I averaged an annual return of just over 20%.
- Since then, performance has waned to around 16% per year, primarily from the down market performance in 2018.
To date, I place a very strong emphasis on investing in the strongest growth opportunities, with pristine financial positions.
- This includes individual companies in multiple sectors, that display combined traits of robust growth, cash flow, and financial strength attributes.
- And also some higher risk exposure to Special Purpose Acquisition Companies, SPACs.
In order to gauge success, I benchmark against all investment options including the universe of mutual funds, ETFs, ETNs, indices, etc. Putting in the work is only worth it if I can consistently compete and beat comparable investment products.
Ultimately, my goal here on Seeking Alpha is to initiate this portfolio management approach and engage those who are serious about investing (with a focus on retail investors), and interested in an ongoing dialogue on working towards strong investment success and wealth creation.
Portfolio Construction & Development
Developing portfolios has been both challenging and quite enjoyable. I have built portfolios with as many as 75 companies, to as few as 20 or so. I have rebuilt my entire portfolio two times during the past nine years. This has included liquidating entire positions (December 2017 and 2019), and rebuilding with some of the same holdings, but fine-tuning as management strategies have been adjusted.
The drastic shifts have been driven by a continued desire to hold the strongest performing companies over time. From earlier days, this has led to a much more stringent focus on aggressive growth opportunities. Through this process, several challenges have emerged.
Challenges
The primary challenge has been the natural tendency to continue to add companies. I've invested long enough to know that regardless of investment risk for any one company, as long as the company is not bankrupt, there will always be a market and a way to make money on it.
My goals as a long-term investor is not to simply make money, but to find the best companies to invest in. On any given year, there are around 15,000+ individual stock investment choices. I firmly believe that a much lower number, perhaps less than 10% or so offer the best potential to yield the greatest investment returns over time.
Companies that I feel are more dangerous than many investors recognize, are those that pay dividends, and/or have strong impacts on the economy, such as high employment. Many of these companies have varying degrees of leverage which is used to support the business. But if I'm looking for growth, I can find much better alternatives, with substantially less credit risk, which in my book, is the paramount risk these days, as we've seen increasingly weaker companies struggle through various economic cycles.
Another challenge I have faced is criticism and scrutiny from other peer investors claiming that I am spreading myself too thin by building a portfolio. Rather, their thoughts are I should pick the best winners and simply ride the wave of success to the beach. While a nice idea in theory, this, in my opinion, is fool's gold and has the potential to lead many retail investors to more losses than gains. Plus, I have a way to capture core growth leaders within the portfolio strategy.
The next two challenges relate to industry expertise and management. First, some may not feel comfortable managing a portfolio due to the potential of owning many holdings in various sectors and industries. This is definitely an important thing to consider, but is not a barrier which cannot be overcome. One must have the ability to deconstruct any individual company, as well as the tools to manage expectations.
Management is highly important because without a management strategy, the portfolio runs the risks of growing to much and/or getting out of control. Key management principles involve short-term versus long-term approaches, and most importantly cash management. I for one, feel every retail investor should have some degree of cash coming in every year to invest for success.
Solutions
Based on these challenges, it is important to construct parameters and strategies to address them. The first of which is to determine what your initial investment capital is, and what your anticipated incoming annual increases will be. If I have $50,000 in initial capital, and I believe I can max out the Roth IRA limit of $6,000, then I can begin to establish how many holdings I could potentially support based on these constraints.
If I owned 20 companies, that would be annual incoming capital of $300 per company spread evenly - with an initial invest position of $2,500. Over a 30-year period, that would equate to $11,500 invested per company, and $230,000 total invested. It is important to always have a cash stream for every year, because as we have learned over the past 20 years (two recessions, numerous industry-impacted corrections, and COVID), market volatility can increase substantially at any given time.
More importantly than timing the market down-cycles though, is consistently investing in companies during each and every opportunity, which speaks to the edge that active management can play.
Other important parameters include developing a screening process to generate stock leads, prioritizing how holdings are selected for the portfolio, and concurrently setting a number of holdings that is reasonable. For screening, I simply use many Web sites including The Fly on the Wall, Barron's and Seeking Alpha among many others, but I rely on custom-built databases and stock price update tools to organize key information by new growth, old growth, and SPAC opportunities.
Prioritizing which companies will ultimately be included in the portfolio can be very subjective. This is why I utilize certain standards that rarely are flexible. The first and foremost is financial superiority. My definition of this is zero net debt. This rule is not entirely inflexible, but I am not interested in companies which depend on debt to grow the business, regardless of the interest rate environment.
Aside from credit risk, I focus explicitly on operating and free cash flow metrics, sales growth, gross margin, and enterprise value metrics. I adamantly suggest retail investors do not solely abide by GAAP indicators from the income statement, nor focus on publicly touted EBIT/EBITDA, P/E, among others. What every investment in any particular company boils down to, is the company's abilities to grow revenue, and the cash that can be generated from such growth. Keeping it simple is very important, granted that we must be able to make relationships of costs, expenses, extraordinary items, etc.
The last parameter I'll touch on relates to performance measurement. There are a few ways one can accomplish this, dependent upon your level of scrutiny. In the earlier period of my portfolios (2012 through 2017), I primarily benchmarked against major indices, The Dow Jones, S&P 500, NASDAQ, Russell 2000. It was not until 2018 that I began to think about benchmarking in a more detailed fashion.
I now firmly believe that over a long period of time, it is more important to benchmark against all assets and strategies, than simply focusing solely on a narrower peer performance. As such, I now focus on thousands of mutual funds, ETFs, ETNs, and indices, which can be broken down into sub-peer areas.
FANGMAT
Recently this year, I have taken a keen interest with my performance against FANGMAT which includes Facebook (FB), Amazon (AMZN), Netflix (NFLX), Alphabet (GOOG), Microsoft (MSFT), Apple (AAPL), and Tesla (TSLA).
There are two important reasons to pay attention to FANGMAT. First, many retail investors have owned these companies over the past 10 years, with most still assuming that these companies will continue to lead the technology sector. Second, institutional investors have achieved strong gains from them over time, making them dependent on their future performance.
From a portfolio perspective, it is also important to note that despite FANGMAT totaling only seven companies, when taking into account their operating segments, one could easily justify that they represent 20-plus companies. This is an important factor to note in that their scale over time has afforded them much success; more simply, anyone claiming a handful of stocks is all you need is out of line if they use FANGMAT as an example today.
Performance
As previously stated, from 2012 through 2017 I averaged an annual return of just over 20%. A lot has happened since then including multiple home transactions, first child, job transitions, etc., and not all of this money has been maintained to date. As such, I am focusing on 2018 as a new baseline. To date in 2020, the portfolio is up just over 36%, looking for consecutive 30%-plus performance after 2018's down year.
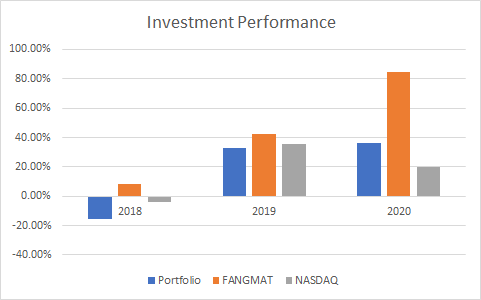
The two benchmarks I monitor each day/week include FANGMAT and the NASDAQ. One of the more interesting aspects of FANGMAT is how it has greatly outperformed the markets during recent contraction periods. 2018 has served as my only negative year, as it was a transition year into more growth oriented holdings for the portfolio, while FANGMAT was up 8%. Since then, I have done quite well, yet FANGMAT has continued to surge, especially during 2020. FANGMAT will be important to continually monitor.
During 2019, I beat out over 96% of the thousands of mutual funds, ETFs, ETNs, and indices I benchmark against. To date in 2020 I am outperforming over 97%. By year-end, I will have a much more advanced tool to illustrate various performance by specific examples such as Fidelity, Vanguard, etc., and/or top performing products.
Holdings
The portfolio has been constructed beginning in January 2020, and currently maintains 54 holdings. Turnover has been higher than normal as can be expected for the volatility driven by COVID. The turnover ratio stands at 31% as a result, with many liquidated companies being more value oriented with gains being re-deployed into better growth opportunities. COVID's unprecedented impact on markets opened one of the most amazing opportunities to invest in nearly anything and everything.
I will note that not one company within FANGMAT is a holding, nor will any of them become one in the future. This is predominantly due to the fact that I am looking for growth from much smaller bases - specifically, I am looking for the future fastest growing companies over the next 30+ years, combining financial strength with strong cash flow performance.
Top 10 Holdings
| Company | Weighting | Performance |
| MercadoLibre (MELI) | 5.36% | 27.04% |
| Shopify Inc. (SHOP) | 4.84% | 30.10% |
| Zoom Video Communications (ZM) | 4.71% | 65.22% |
| Twilio Inc. (TWLO) | 3.63% | 27.95% |
| Quidel Corporation (QDEL) | 3.56% | 31.04% |
| Roku Inc. (ROKU) | 3.02% | 57.24% |
| Crowdstrike Holdings Inc. (CRWD) | 2.82% | 47.61% |
| Teledoc Health, Inc. (TDOC) | 2.76% | 13.65% |
| Pershing Square Tontine Holdings, Ltd. (PSTH) | 2.48% | 7.17% |
| Hyliion, Inc. (SHLL) | 2.15% | 203.71% |
Top 11-30 Holdings
| Company | Weighting | Performance |
| Vertex Pharmaceuticals, Inc. (VRTX) | 2.14% | 1.84% |
| Docusign Inc. (DOCU) | 2.09% | 35.50% |
| Dexcom Inc. (DXCM) | 2.09% | 26.92% |
| Chewy Inc. (CHWY) | 1.99% | 21.42% |
| Workhorse Group, Inc. (WKHS) | 1.97% | 229.25% |
| Square Inc. (SQ) | 1.95% | 85.10% |
| Slack Technologies, Inc. (WORK) | 1.92% | -7.30% |
| Splunk Inc. (SPLK) | 1.88% | 0.28% |
| Ulta Beauty, Inc. (ULTA) | 1.87% | 14.51% |
| Nikola Corporation (NKLA) | 1.84% | 4.82% |
| Stamps.com Inc. (STMP) | 1.82% | -4.59% |
| Intuitive Surgical, Inc. (ISRG) | 1.76% | 29.55% |
| Opendoor, Inc. (IPOB) | 1.72% | 26.82% |
| Lordstown Motors (DPHC) | 1.71% | 147.10% |
| MP Materials (FVAC) | 1.70% | 18.65% |
| Fisker Inc. (SPAQ) | 1.63% | 32.54% |
| Arista Networks Inc. (ANET) | 1.62% | 3.23% |
| Beyond Meat Inc. (BYND) | 1.60% | 45.44% |
| Okta, Inc. (OKTA) | 1.59% | 13.30% |
| Social Capital Hedosophia Holdings Corp. III (IPOC) | 1.58% | 17.12% |
Remaining Holdings
| Company | Weighting | Performance |
| Wayfair Inc. (W) | 1.56% | 15.09% |
| Velodyne Lidar (GRAF) | 1.54% | 68.98% |
| Vroom, Inc. (VRM) | 1.50% | -7.78% |
| Paycom Software, Inc. (PAYC) | 1.47% | 55.15% |
| Pinterest, Inc. (PINS) | 1.39% | 120.59% |
| Datadog (DDOG) | 1.38% | 72.96% |
| Atlassian Corp. (TEAM) | 1.38% | 8.50% |
| Spotify Technology (SPOT) | 1.26% | 29.55% |
| Delta Air Lines, Inc. (DAL) | 1.23% | 53.08% |
| ServiceNow, Inc. (NOW) | 1.22% | 72.95% |
| Floor and Décor Holdings (FND) | 1.18% | 76.87% |
| The Trade Desk Inc. (TTD) | 1.17% | 156.32% |
| Xencor, Inc. (XNCR) | 1.15% | 45.27% |
| Vaxcyte, Inc. (PCVX) | 1.08% | 69.41% |
| SolarEdge Technologies, Inc. (SEDG) | 1.00% | 126.82% |
| Costco Wholesale Corporation (COST) | 0.90% | 11.00% |
| Align Technology (ALGN) | 0.86% | 131.70% |
| Canoo, Inc. (HCAC) | 0.82% | 11.93% |
| Hubspot Inc. (HUBS) | 0.74% | 116.64% |
| Abiomed Inc. (ABMD) | 0.71% | 113.56% |
| AeroVironment, Inc. (AVAV) | 0.68% | 9.59% |
| Schrodinger, Inc. (SDGR) | 0.60% | 38.19% |
| Workday Inc. (WDAY) | 0.54% | 63.53% |
As I alluded to above, describing FANGMAT's operating holdings encompassing greater than 20 companies; I believe that a portfolio can have anywhere from 20-30 companies that can have a very strong impact on driving the majority of performance.
The current number of holdings at 54, will likely increase back towards 70 or so in the near-term. The top 30 holdings will be key to leading performance over the long-term. As can be seen above, there is not much difference between the three tables for high/low holdings, so in the near-term, companies should be expected to ebb and flow between these tables.
Value I Bring to the Investment Community
I consider myself the poor-man's Wall Street portfolio manager. I have diligently deconstructed many different industries from global supply chain relationships to more simplified U.S.-based production and consumption.
The value I bring is the combination of technical analysis and adept decision making abilities to gauge market dynamics, especially during times of volatility and extreme pressure. Attaining annualized returns near 20% over the past decade, adds a solid track record of performance.
Individual Company Analysis
I have constructed hundreds of financial models for individual companies over the past decade, focusing on the most important financial metrics, that ironically, do not get much public consideration. All financial information goes back to 2008, if applicable.
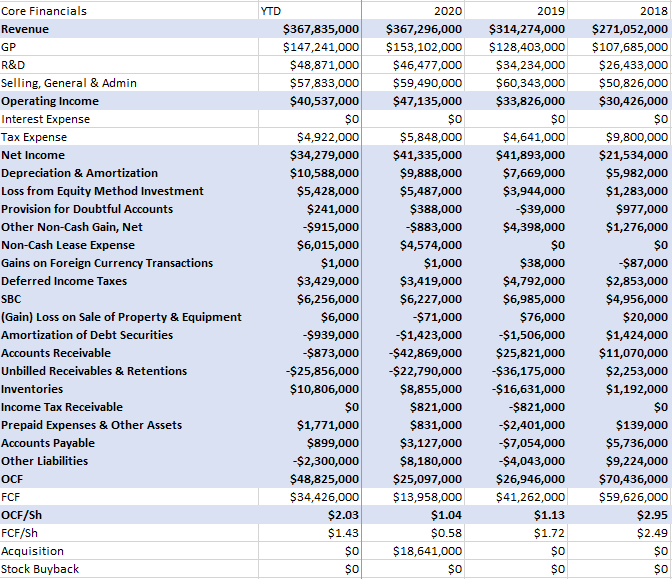
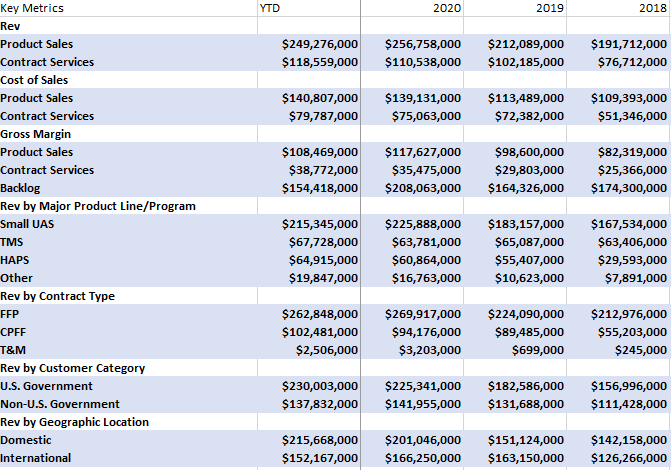
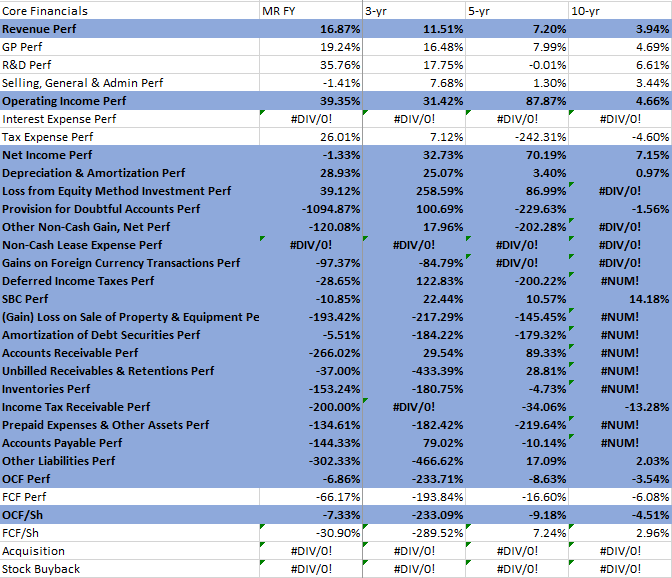
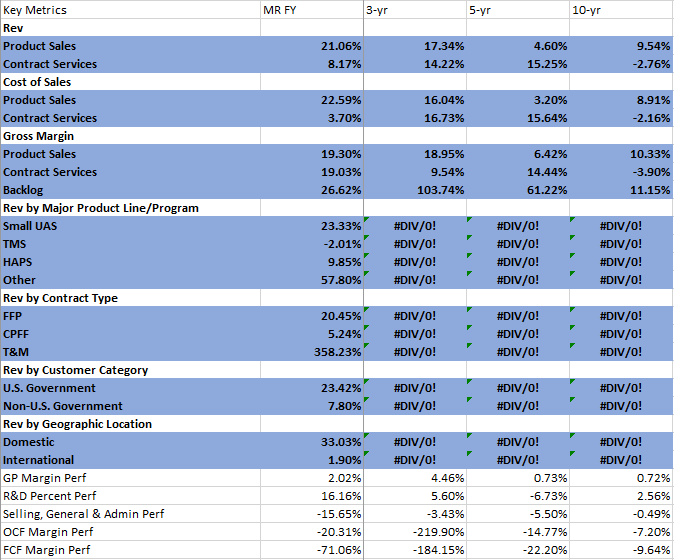
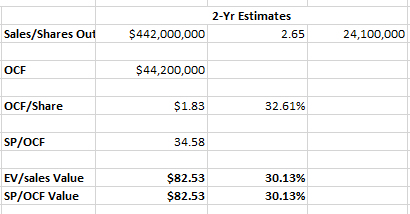
AeroVironment Sample
Historical and year-to-date, YTD, Comprehensive Financial Information
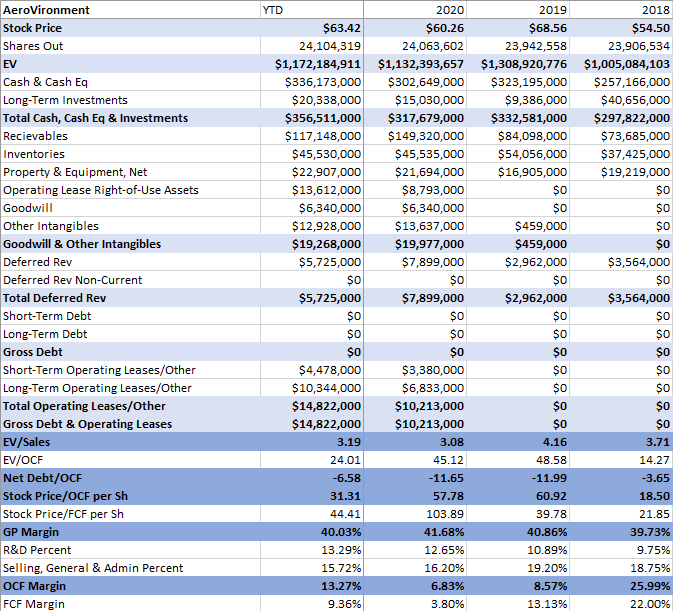
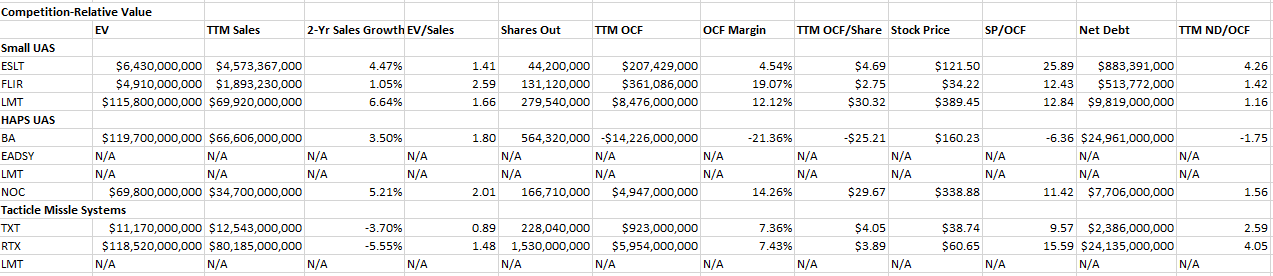
Detailed Competitive Peer Valuation Analysis
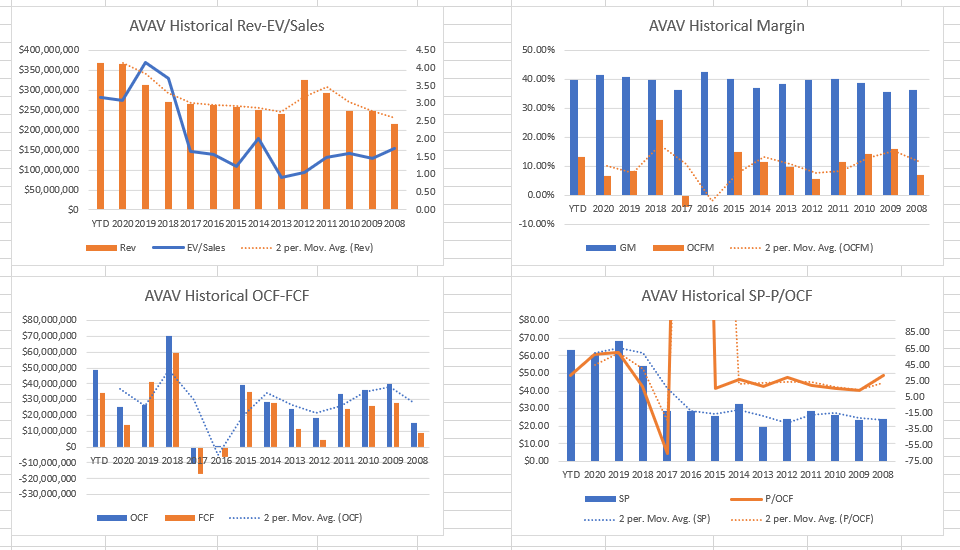
Historical Valuation Analysis
Short-Term Forecast and Valuation
Screening Tools
I have developed screening tools building portfolios of companies in databases, as well as having subscription information to provide analyst coverage updates, and other key pieces of information.
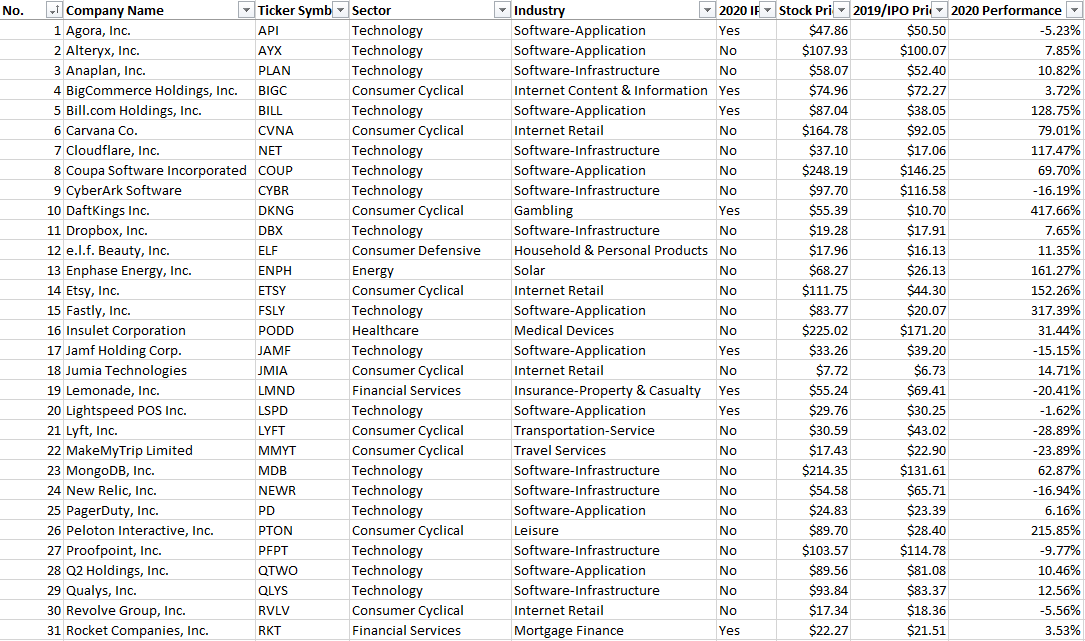
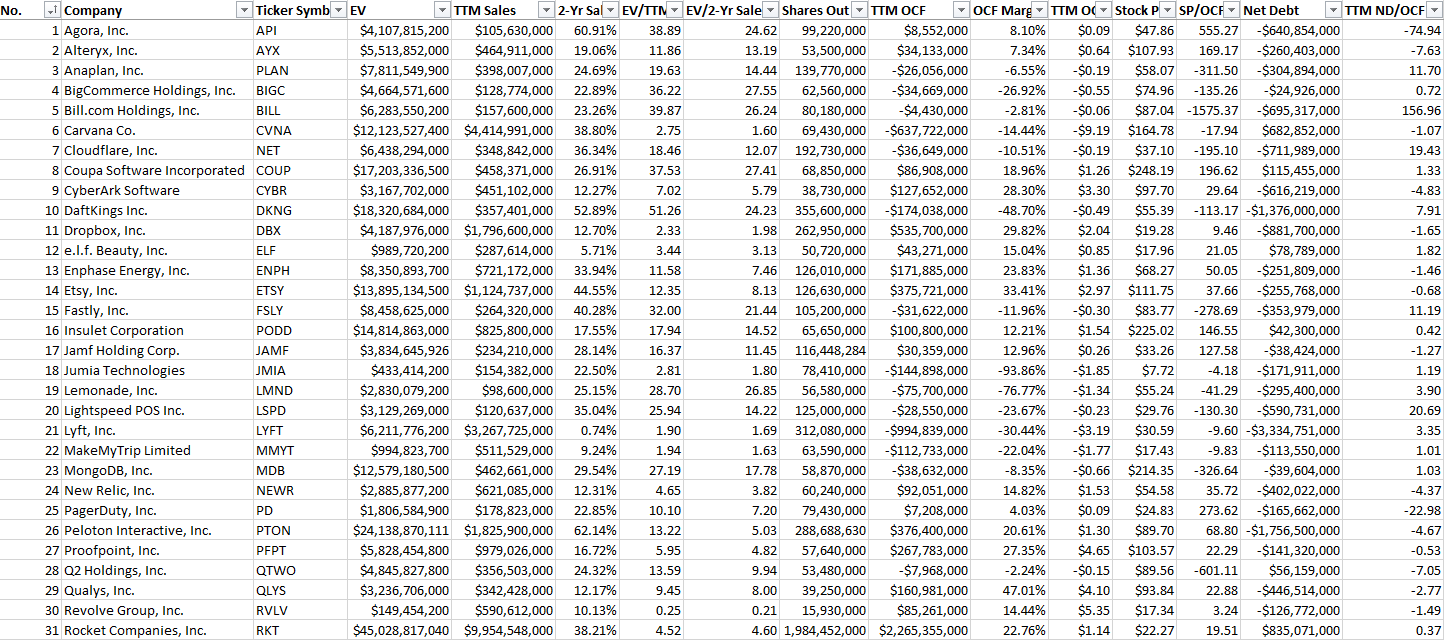
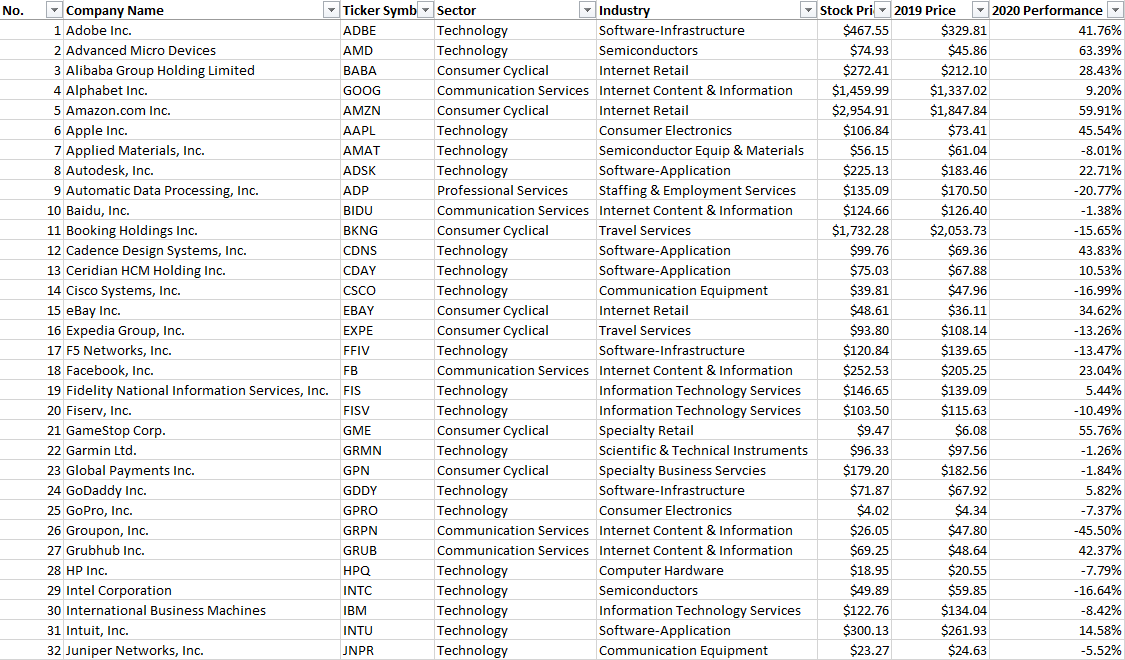
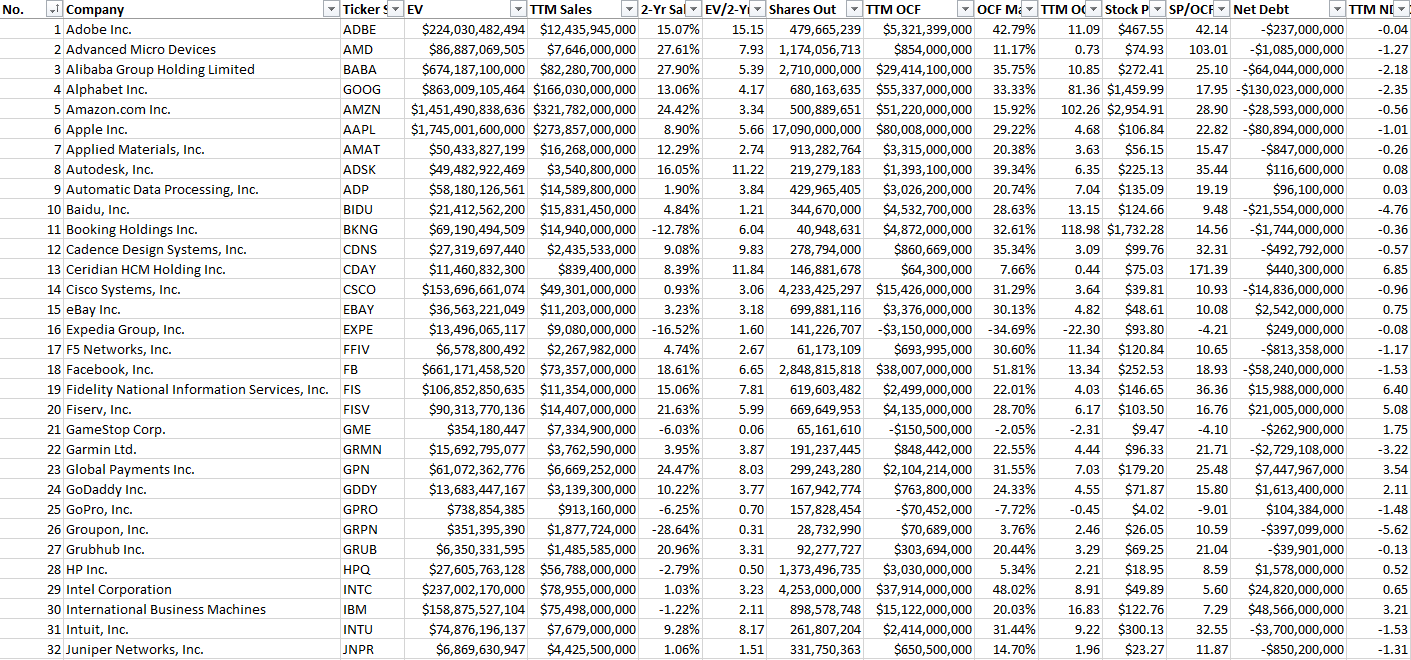
Companies are screened between new growth and old growth to determine enterprise valuation, EV, competitiveness, and most importantly, financial strength, and cash flow considerations.
New Growth-Based Company Database
Old Growth-Based Company Database
SPAC Analysis
I have spent the past few months deconstructing SPAC information via the SEC's Edgar Database Tool, to generate leads for special high-risk near-term investment opportunities.
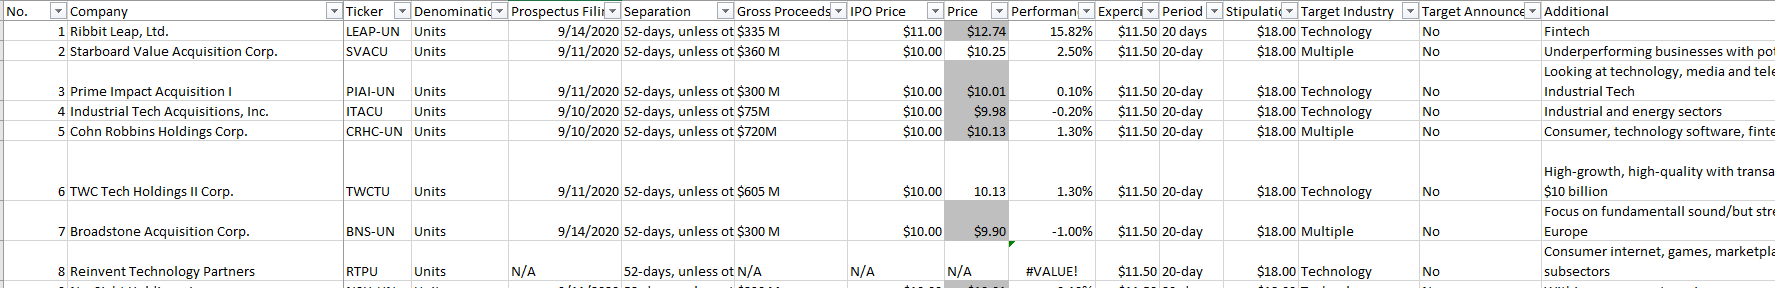
I am well versed in quickly deconstructing SPAC opportunities based on the earliest stage of the game S-1 filings, as well as the entire SPAC process from identifying a target, to going through a merger, and related impacts to SPAC units, common shares, and warrants.
SPACs have taken the investment world by storm this year, especially as higher profile companies are now considering them. Additionally, Wall Street has shifted into SPACs aggressively with book-running now being undertaken my many large investment banks.
SPACs are going to have to witness some serious strong performers over the next two-five years in order for them to become legitimate investments for long-term investors. This will remain to be seen.
Why Do This?
After 10 years of continual rigorous analysis, I always like to take a step back and ask myself every now and again, why am I doing this?
- First, aside from serving God, my family, my employment responsibilities, and my community, this is the most enjoyable thing I could imagine doing with my time.
- Second, my performance record indicates that I have the aptitude to be successful when benchmarked against professional products.
- Lastly, I despise social media, but this provides me an outlet to be a part of something, not just for myself and my family, but with others who share similar interests.
Conclusion & Next Steps
This overview and insight into my portfolio and investment approach is meant to engage any Seeking Alpha members which are interested in similar companies, and/or investment strategies.
Every company (and then some) that is included in my portfolio has its own detailed financial model database as illustrated with AeroVironment. I have reviewed and scoured through hundreds upon hundreds of financial filings, I have deconstructed industries, commodities, and many other analyses, just for fun!
I will be updating my management strategies within each week, as well as providing commentary on multiple stocks whether a holding within the portfolio, a new IPO or SPAC, or something that piques my interest.
Please feel free to discuss any relevant topics that you may have based on the information I have provided, or anything else investment-related in general. I look forward to being a part of a hopefully engaging environment on Seeking Alpha that leads to great discussions, and most importantly, tangible long-term investment returns.
Numbers 6: 24-26
"The Lord bless you and keep you;
The Lord make His face shine upon you,
And be gracious to you;
The Lord lift up His countenance upon you,
And give you peace."