It's time for a quick check on the housing REITs. The sector has seen some pain over the last several weeks as investors are concerned about declining rent and occupancy. These are significant concerns, though long term they should pass. Young people can't live with their parents forever and the population didn't shrink by several million.
We're pulling up the apartment REITs and starting with some yield metrics:
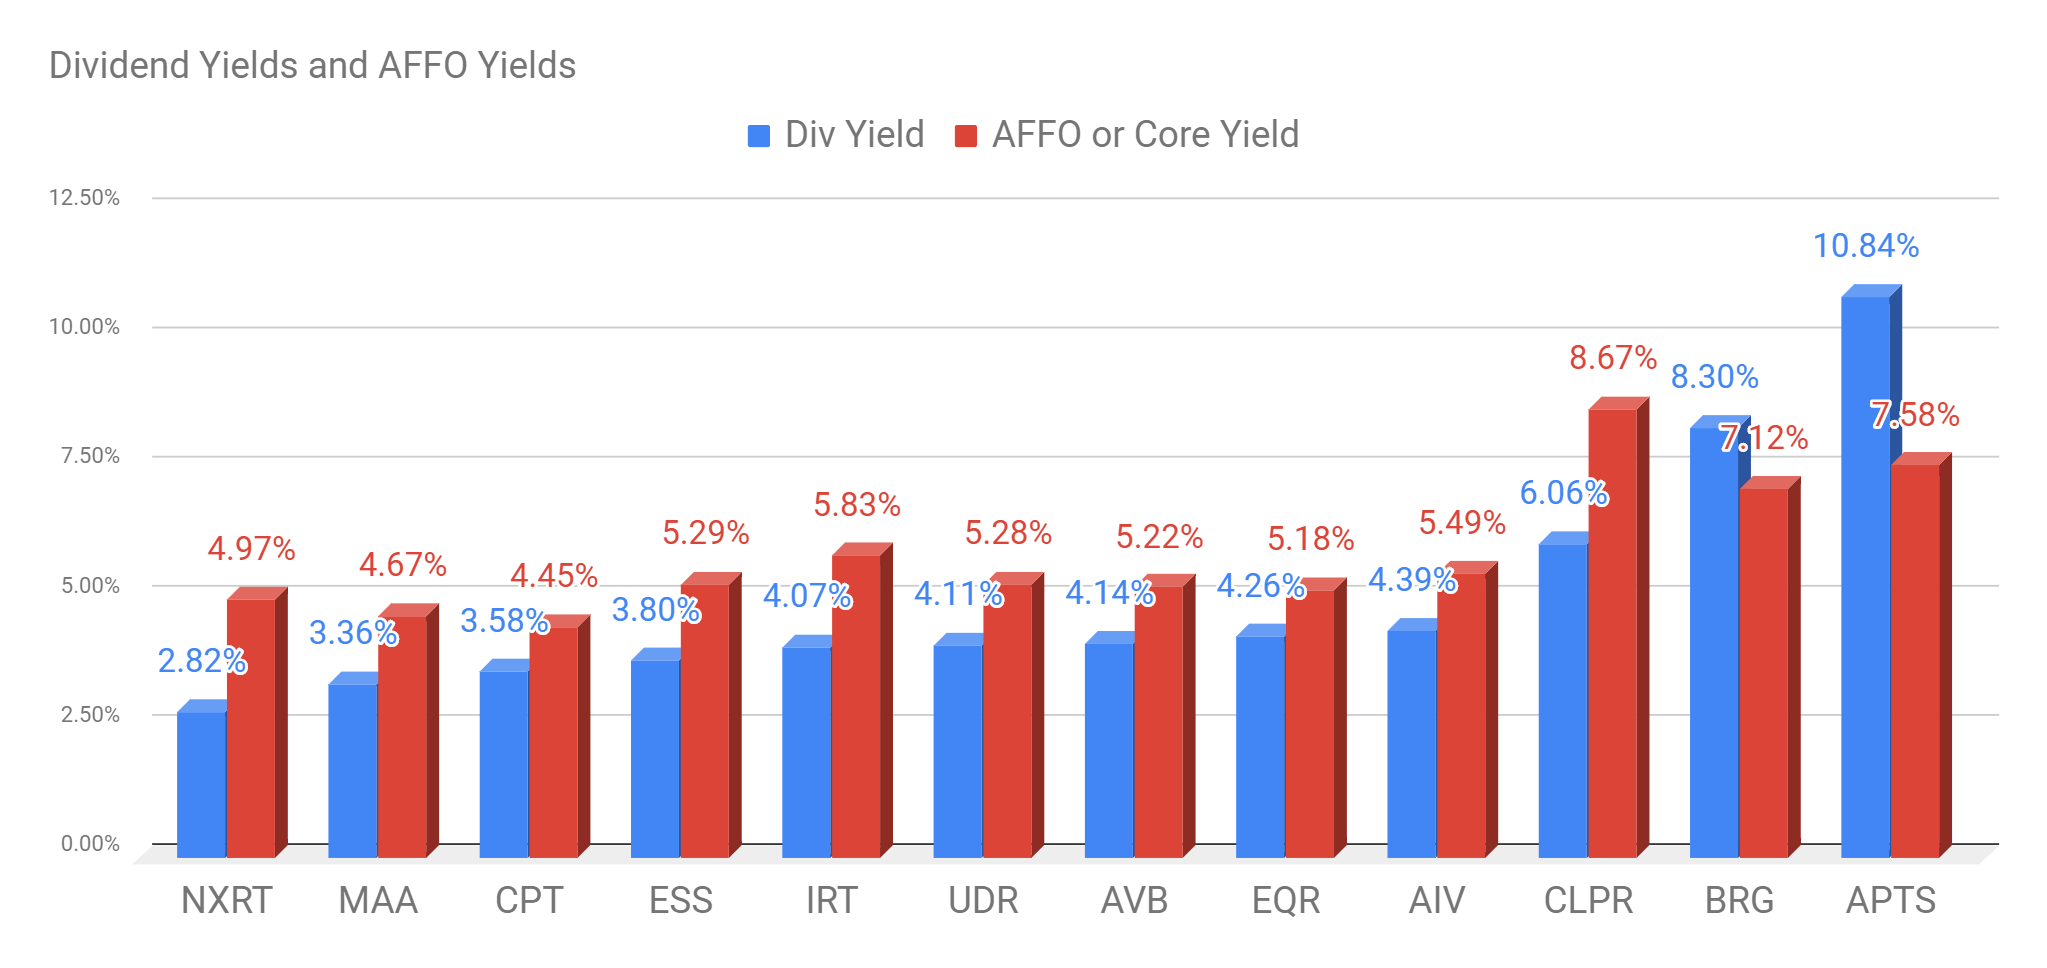
| Company Name | Ticker | Div Yield | AFFO or Core Yield |
| NexPoint Residential Trust Inc. | NXRT | 2.81% | 4.96% |
| Mid-America Apartment Communities Inc. | MAA | 3.36% | 4.67% |
| Camden Property Trust | CPT | 3.57% | 4.44% |
| Essex Property Trust Inc. | ESS | 3.80% | 5.29% |
| Independence Realty Trust Inc. | IRT | 4.07% | 5.84% |
| UDR, Inc. | UDR | 4.11% | 5.28% |
| AvalonBay Communities Inc. | AVB | 4.13% | 5.22% |
| Equity Residential | EQR | 4.25% | 5.17% |
| AIMCO | AIV | 4.38% | 5.49% |
| Clipper Realty | CLPR | 6.06% | 8.67% |
| Bluerock Residential Growth REIT | BRG | 8.30% | 7.12% |
| Preferred Apartment Communities Inc. | APTS | 10.84% | 7.58% |
Organized by dividend yield, the highest yields come from BRG and APTS. We added a chart that looks better than the table:
Source: The REIT Forum
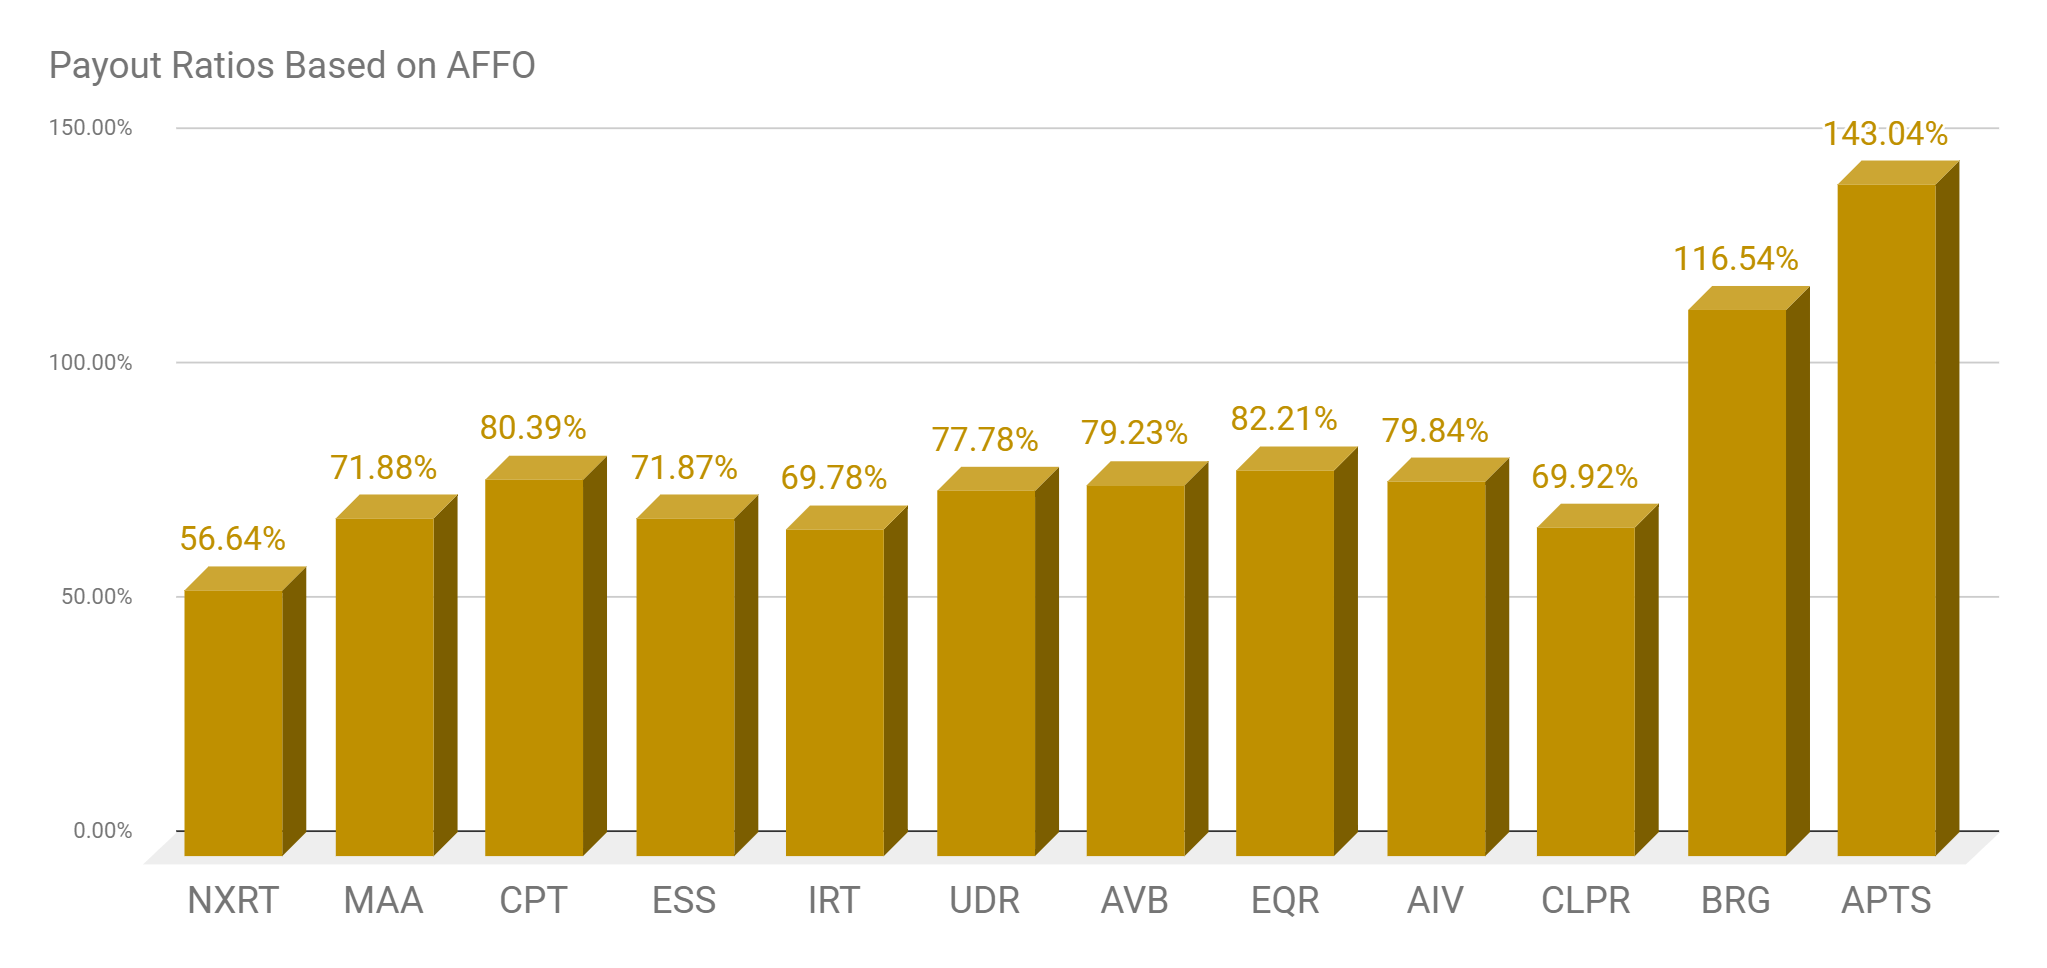
Now you may notice an issue towards the right side of that chart. The red bar isn't as tall as the blue bar. That means the payout ratio will stink. Here are the payout ratios:
Source: The REIT Forum
It would appear that BRG and APTS carry exceptionally high risk. It would be nice to know if they were dividend cutters.
We can start with BRG's dividend history:
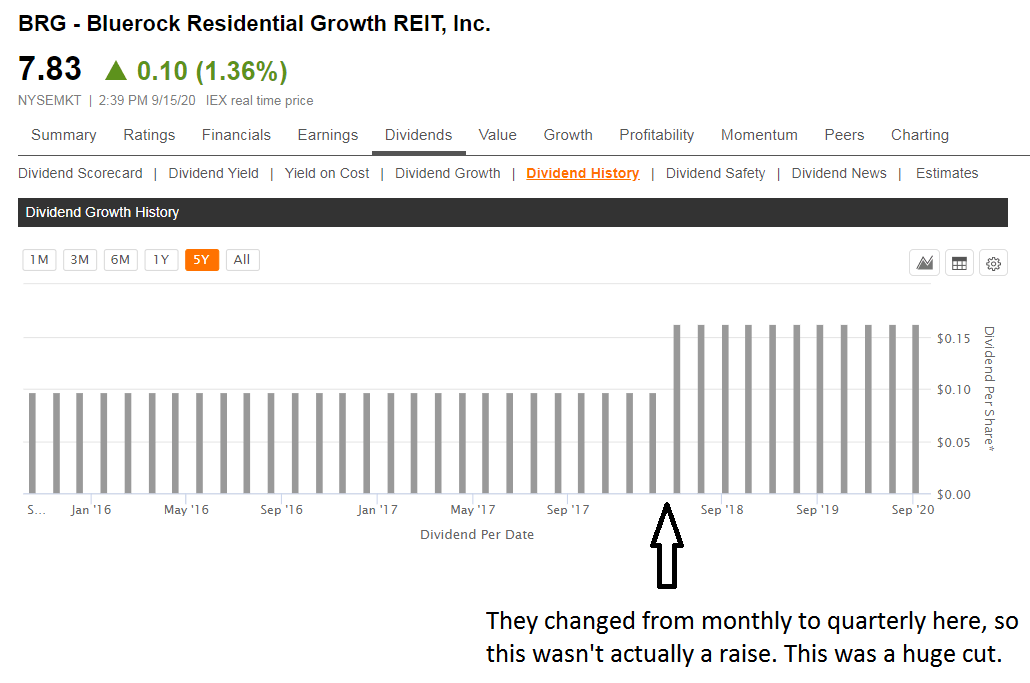
Source: Seeking Alpha
Well, that's terrible. Why did they cut the dividend during a period when apartment REITs were generally doing so well. Was there an issue with AFFO per share?
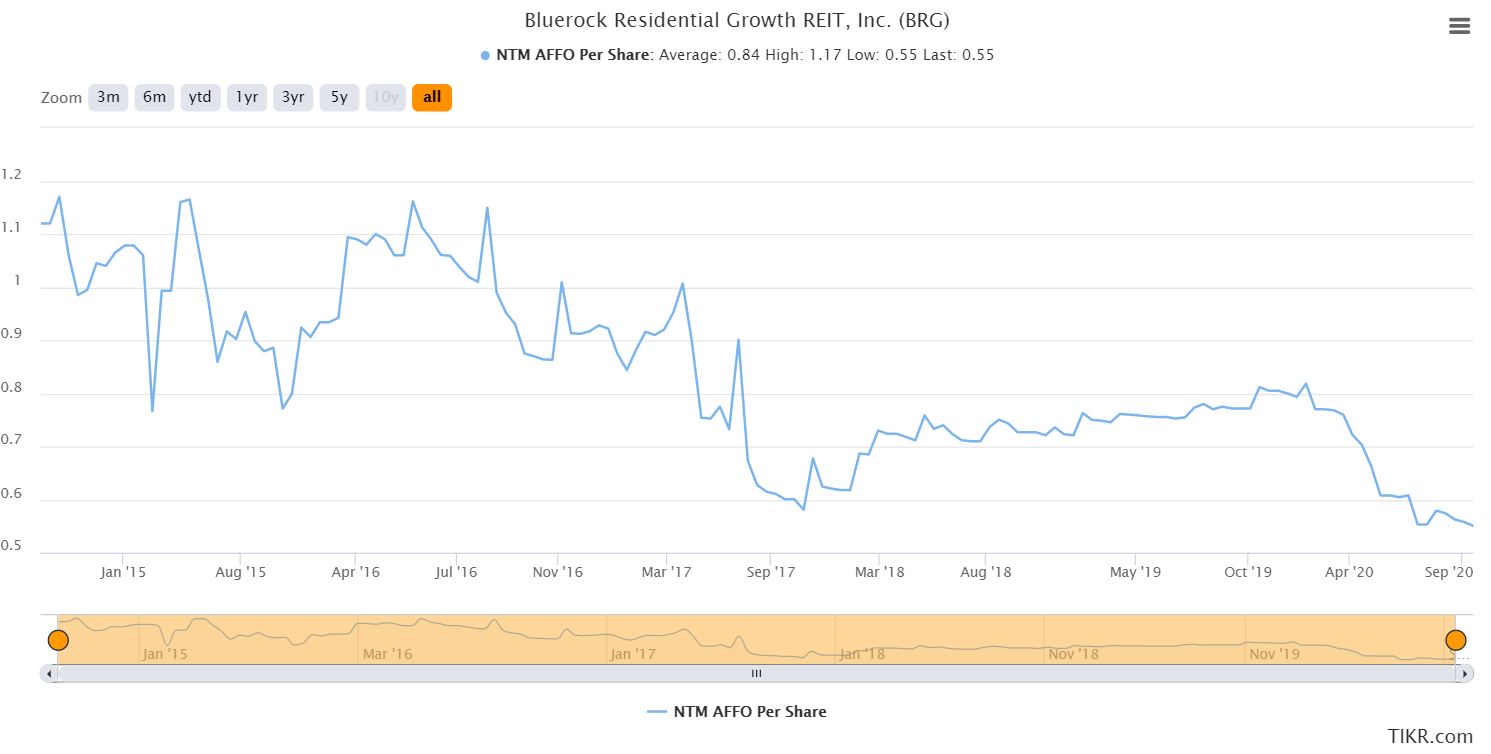
Source: TIKR.com
Oh, that stinks. I can't help but notice that it appears the line tends to go downwards as it moves to the right.
How about APTS?
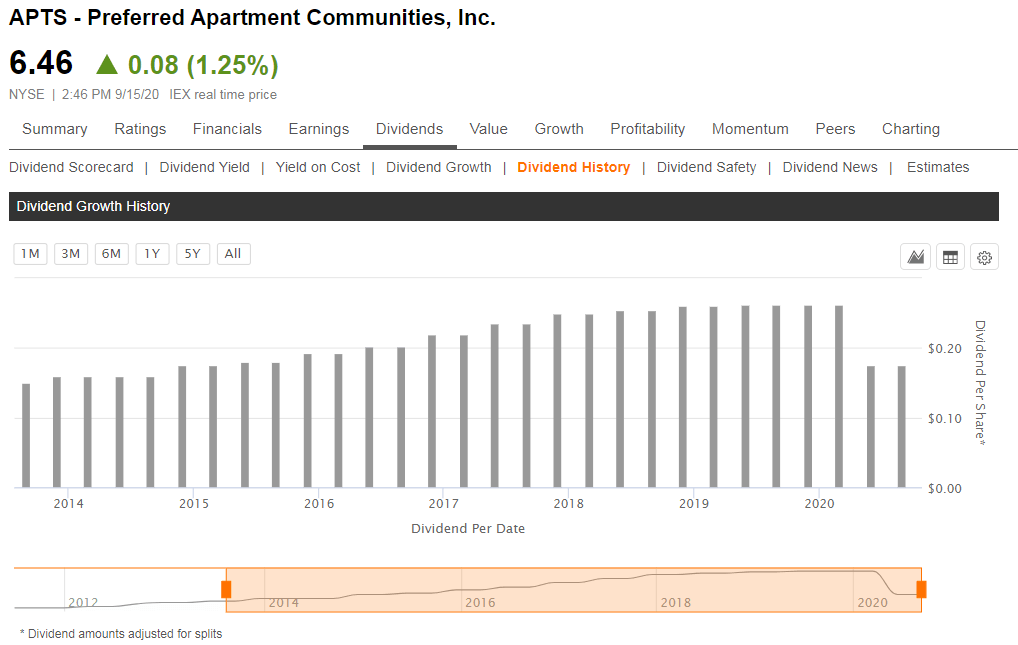
Source: Seeking Alpha
Well, they already chopped the dividend in 2020. How can the payout ratio still be that high? Is estimated AFFO per share just falling?
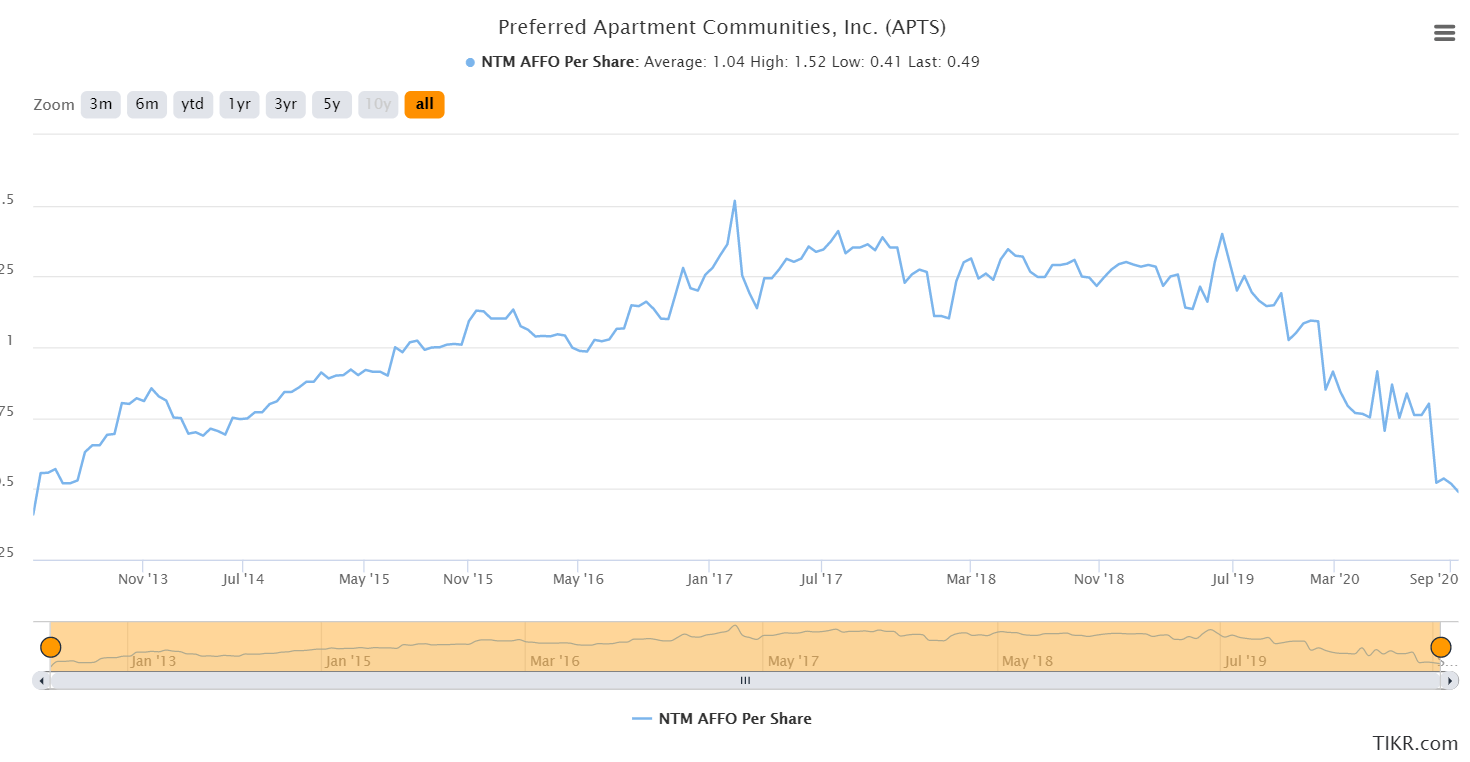
Source: TIKR.com
Well, that would explain it. Those values got hammered in 2020. Estimates went from around $1.08 to $.49. Ouch.
Price to NAV
The price-to-NAV metric can be a useful check for apartment REITs. Investors shouldn't make it the centerpiece of their thesis for a stock, but it helps to provide some insight. So how are the apartment REITs priced?
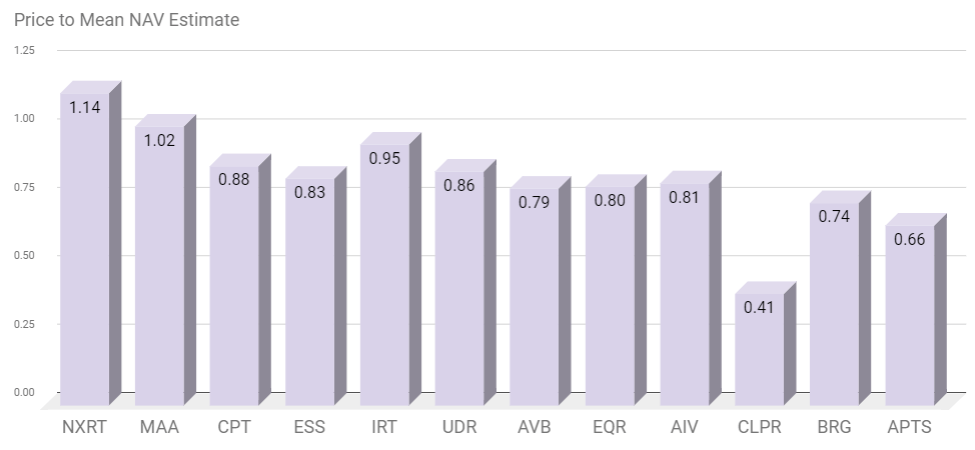
Source: The REIT Forum
What's the connection? Excluding the 3 to the right, the correlation is coastal exposure. With more difficulty in some of the higher-cost metros (which are primarily coastal), we are seeing larger discounts to NAV for those REITs.
You may wonder if valuations on coastal apartment buildings are simply plunging. It doesn't look that way. AIV announced they would split the company into two parts to improve transparency. At the same time, they sold part of their California portfolio. The transaction had an implied cap rate on NOI of about 4.2%. The value in the deal came in at 97% of management's Gross Asset Value. AIV is one of the few equity REITs to publicly provide updated estimates on the gross value and net value of their assets.
Note: While BRG and APTS tend to have the most difficulties, the prices have fallen so far that it isn't even worth being bearish on them. Consequently, we won't be assigning ratings to BRG or APTS.
Woe is The Landlord
Here's a chart taken completely out of context:
Source: TIKR.com
If that's all you saw, you might reasonably conclude that Essex Property Trust is getting wrecked.
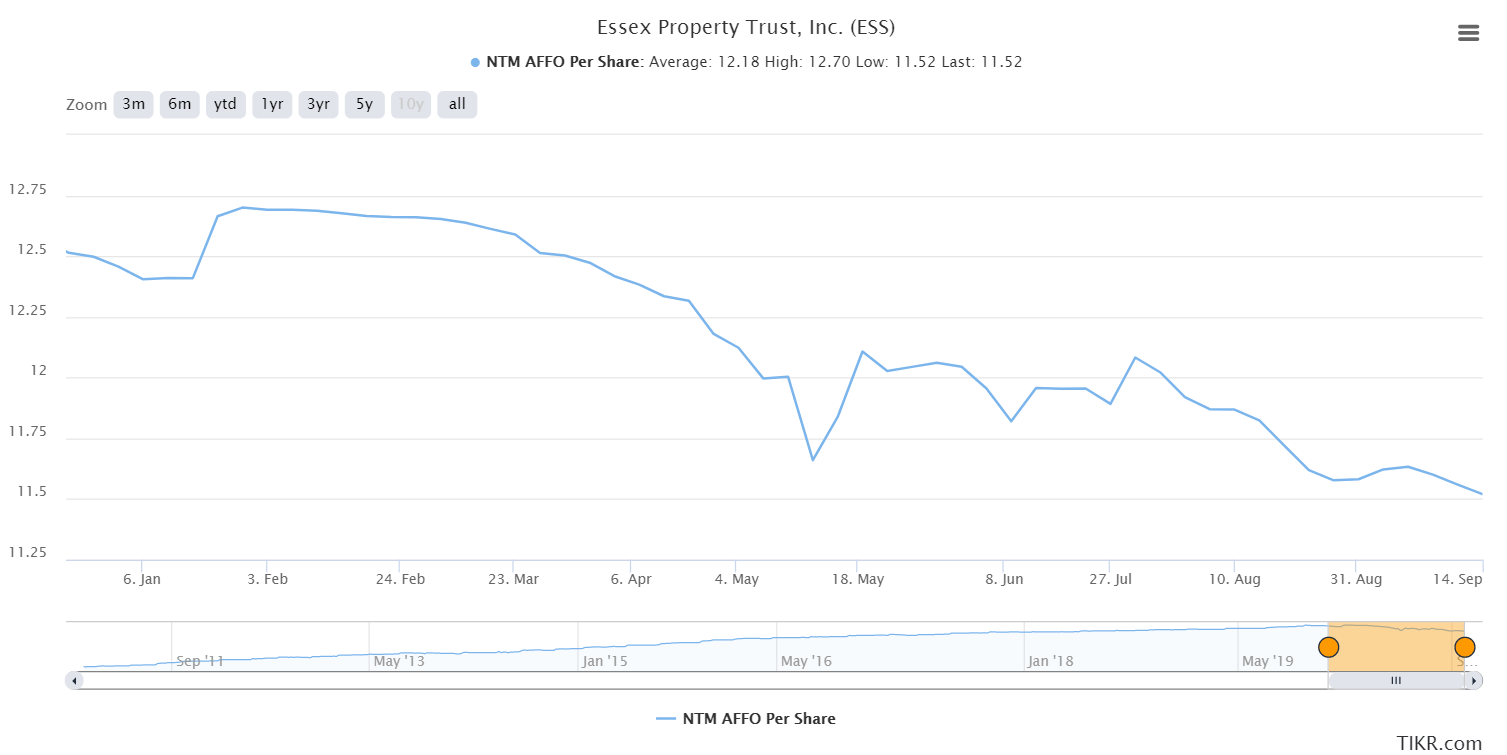
Let's take a long-term view:
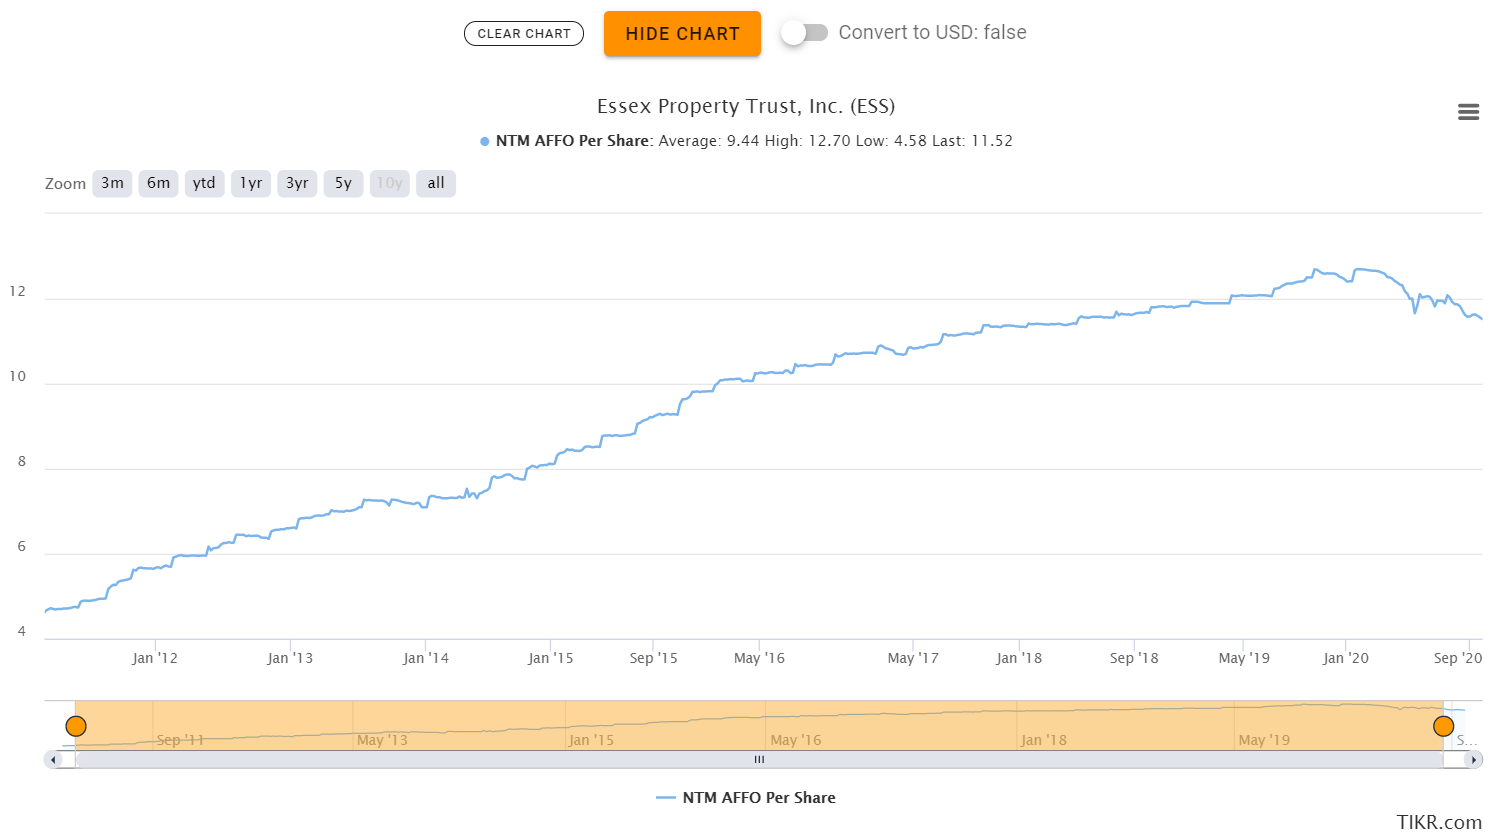
Source: TIKR.com
That's a dramatically different picture. It really puts the decline in perspective. Expect AFFO per share to stink this year. Rental rates are lower and many leases contain concessions such as a month of free rent. Yeah, that's rough. Now try saying these words out loud:
"In 5 years, rental rates in Los Angeles will be cheaper than they are today."
Could you say it with a straight face?
Try saying this one:
"Investments in automating apartment showing and scheduling repairs, which are already reducing expenses, will suddenly fail as renters refuse to use smartphones."
I'm predicting that 5 years from today we see higher rents than we do today. I'm also predicting that "controllable operating expenses" (which includes things like showing apartments and handling repairs) will also be slightly lower as a percentage of revenue.
We'll just continue to be bullish here:
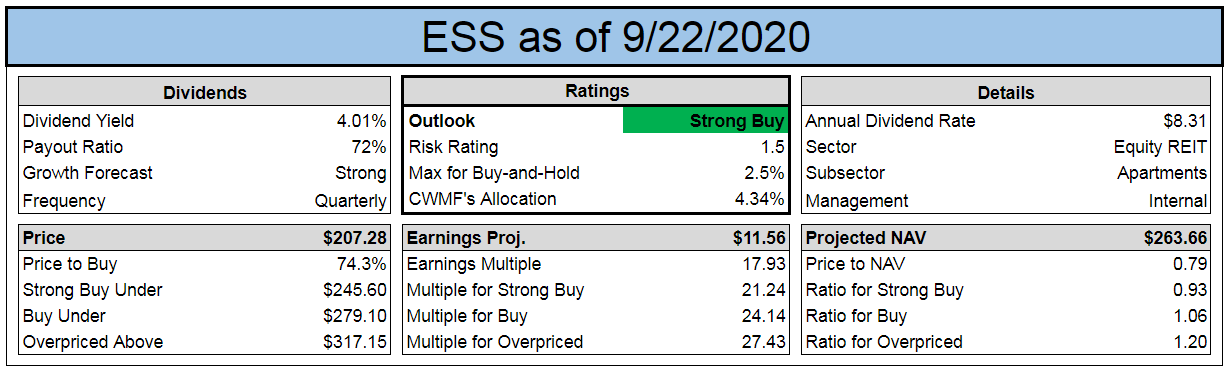
Source: The REIT Forum
Conclusion
The discounts to NAV suggest that many of these REITs are still trading at very attractive valuations. We concur. There are some great values in the sector. We're interested in the REITs with strong economies of scale, great management teams, and a history of growing dividends and FFO per share.
Of course, 2020 will be a rough year for FFO per share. We should expect some weakness to spill over to 2021 as well. That's fine. It is short-term pain. These are exceptional long-term dividend-growth machines.

We are the only large REIT Research service on Seeking Alpha with:
- A CPA on the team.
- A record going back to the start of 2016.
- A real-money portfolio worth over a quarter-million with full disclosure on every trade.
- Real-time notifications on every purchase and every sale, including exact share count, purchase price, dividends earned, and sale price.
- Scott Kennedy's exclusive coverage on BDCs.