September 2020 was the first losing month for the broad market index since the large drawdown in March. The Dividend Aristocrats (BATS:NOBL) proved their defensive bonafides, outperforming in the September sell-off by 241bp on the month as depicted in the chart below.
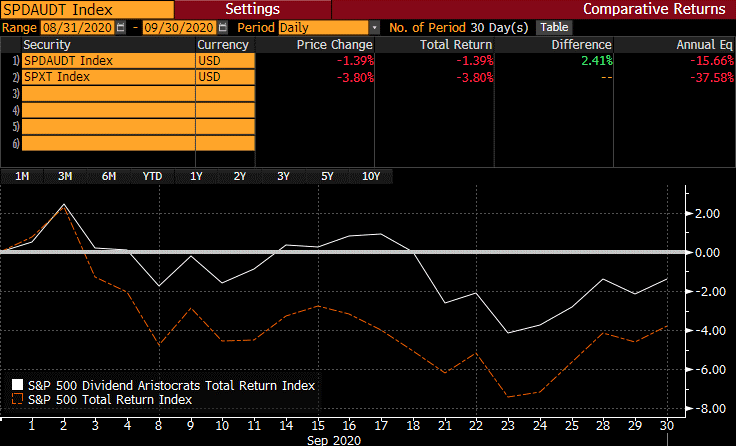 Source: Bloomberg
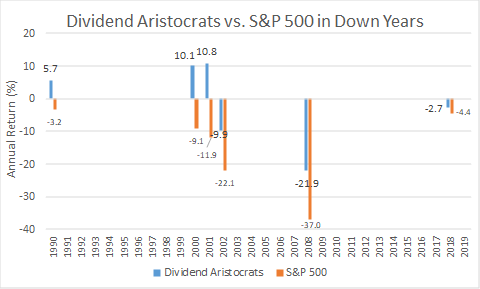
The Dividend Aristocrat strategy has historically outperformed in down markets. The graph below depicts the performance of the Dividend Aristocrats versus the broad S&P 500 index from which they are pulled in each of the last six down years for stocks - 1990, 2000-2002, 2008, and 2018 - in the past three decades.
 This ability to outperform in down markets, and keep pace in up markets has allowed the dividend growth strategy to beat the broader market over the past thirty-plus years. Since the beginning of 1990, owning S&P 500 components with at least a 25-year history of growing their dividends has outperformed the broad S&P 500 (SPY) by 1.78% per year.
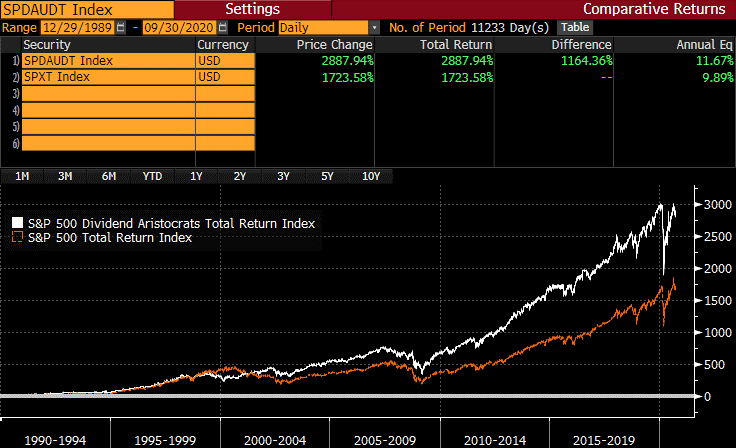 Source: Bloomberg
Despite the tendency for the Dividend Aristocrats to outperform in down markets, the strategy has lagged in 2020. For the full year, the strategy is down 2.6% while the S&P 500 is up 5.57%. Almost all of this underperformance is attributable to the strategy's tech underweight, and underweight to Amazon in Consumer Discretionary.
With the strategy generating long-run outperformance over multiple business cycles, but lagging in 2020 due to a structural underweight to the high-flying tech stocks, some investors might be spying an opportunity.
In the table below, the list of the current Dividend Aristocrat constituents is sorted descending by indicated dividend yield, and lists total returns, including reinvested dividends, over trailing 1-, 3-, 6-, and 12-month periods.
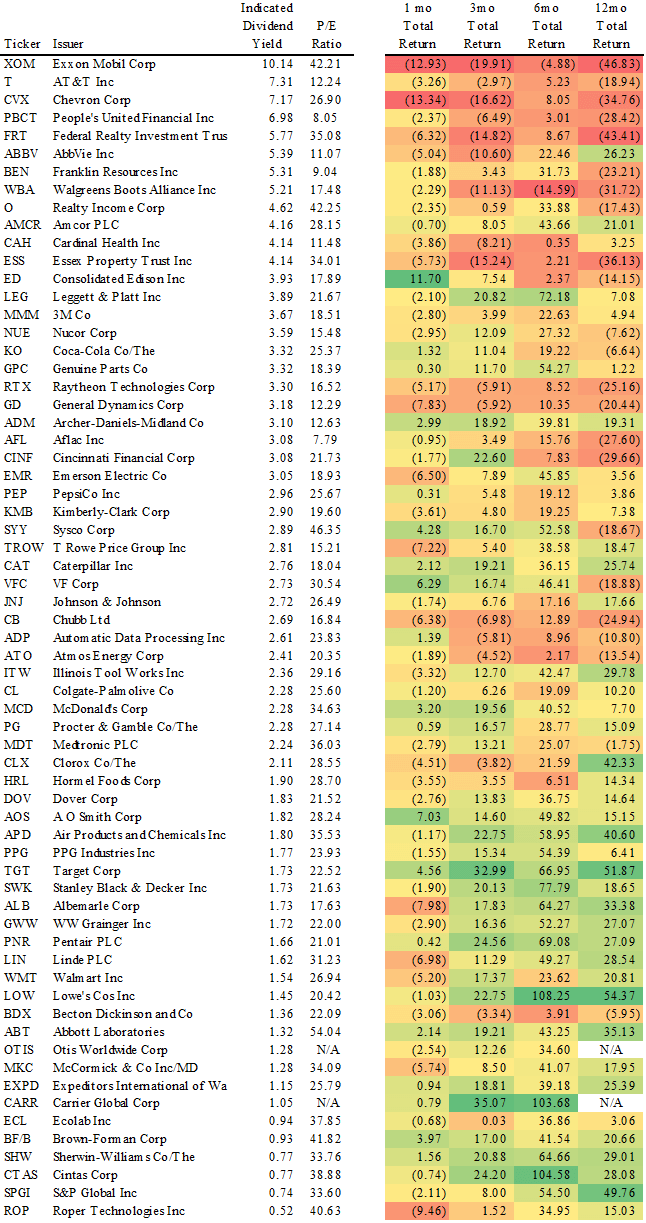 Here are a couple of notable observations from this list:
- While the Dividend Aristocrat Index outperformed the S&P 500 in September, only 19 of 65