Corning: Illusory EPS And 'Leaky Equity Bucket' - Avoid

Nov. 04, 2020 12:15 PM ETCorning Incorporated (GLW) StockGLW65 Comments
Robert Honeywill
8.16K Followers

Summary

  • Corning's reported non-GAAP earnings exclude a large amount of unusual items, which nevertheless involve real monetary outlays.
  • Over the last 3.75 years, dividends paid out of equity exceed the amount of income flowing into equity, if both "core" and unusual items of expense are taken into account.
  • Share repurchases and a portion of dividends have been funded by significant increases in net debt.

Investment Review: Corning Incorporated

Corning Incorporated (NYSE:GLW) offers poor prospects for share price growth. Increases in indebtedness to fund share repurchases has been ineffective for growing EPS, and has weakened the balance sheet. The headline "Core" earnings and EPS are illusory from a point of view of income available to pay dividends and fund share repurchases. Corning may benefit from increased revenue for some of its businesses supplying products related to the ongoing COVID-19 pandemic. This is considered unlikely to bridge the gap between the realistically calculated net income, available for distribution to shareholders, and the dividend payment. Increased borrowings are likely to be continued to be required for partial funding of the dividend. I set out below the detailed case in support of these opinions.

Looking for share market mispricing of stocks

What I'm primarily looking for here are instances of share market mispricing of stocks due to distortions to many of the usual statistics used for screening stocks for buy/hold/sell decisions. The usual metrics do not work when the "E" in P/E is distorted by the impact of COVID-19. And, if the P/E ratio is suspect, so too then is the PEG ratio similarly affected. I believe the answer is to start with data at the end of 2019, early 2020, pre COVID-19 and compare to projections out to end of 2022, when hopefully the impacts of COVID-19 will have largely dissipated. Summarized in Tables 1, 2, and 3 below are the results of compiling and analyzing the data on this basis.

Table 1 Detailed Financial History And Projections

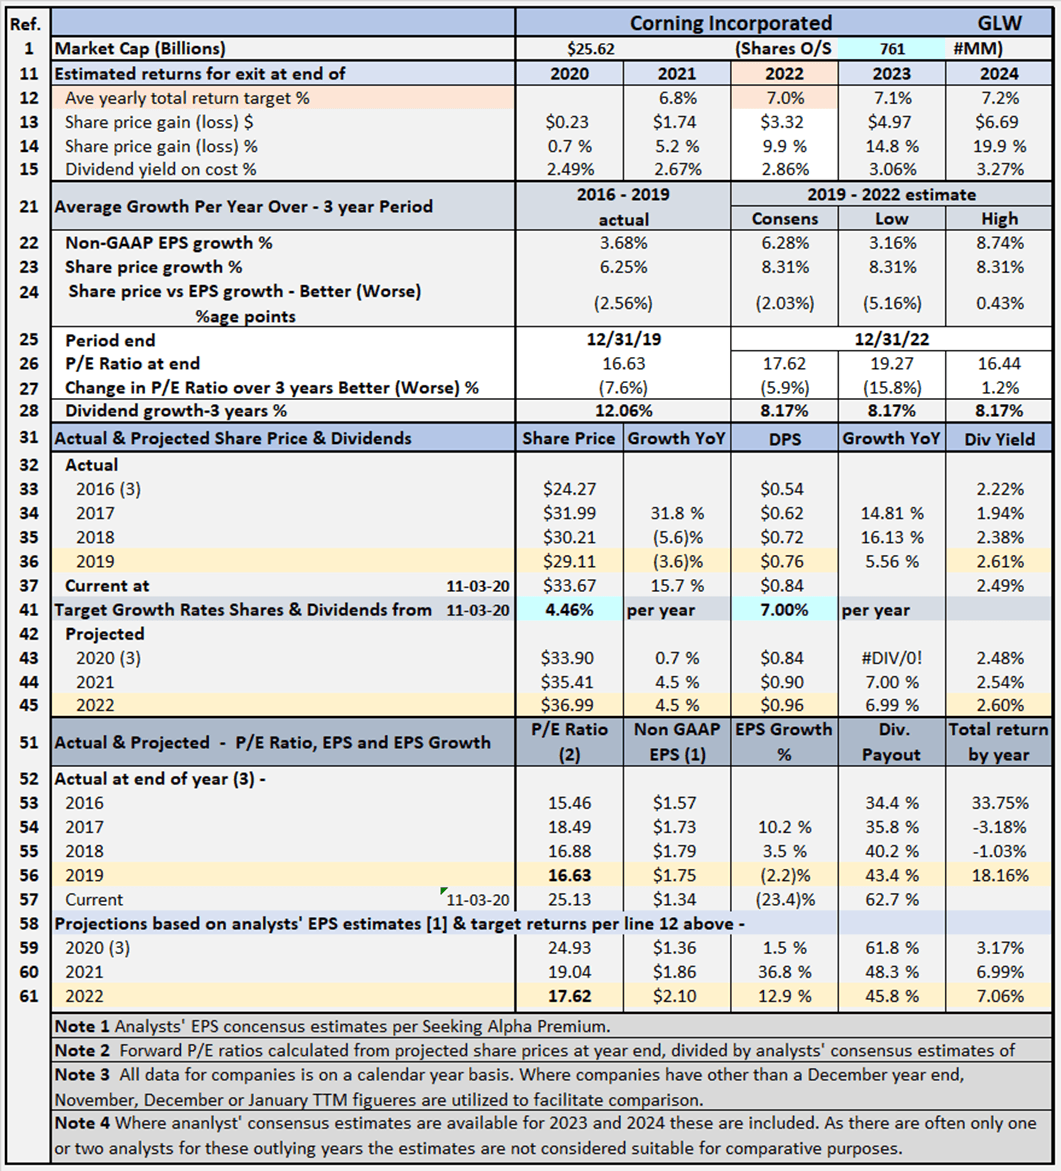
Table 1 documents historical data from 2016 to 2019, including share prices, P/E ratios, EPS and DPS, and EPS and DPS growth rates. The table also includes estimates out to 2022 for share prices, P/E ratios, EPS and DPS and EPS and DPS growth rates (note estimates

Dividend Growth Income+ Club Register today for your Free Trial.

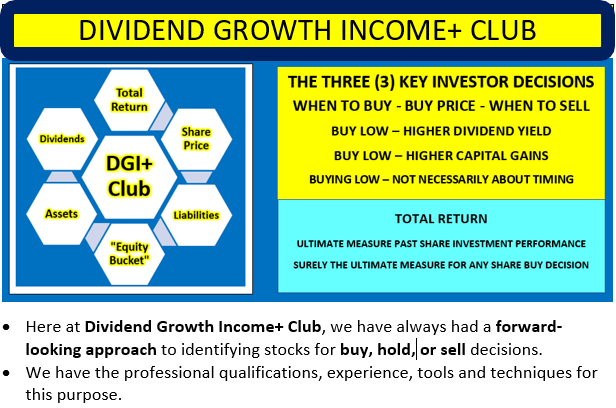
Click Triple Treat Offer  (1) Your Free 2 Week Trial; (2) 20% Discount New Members; (3) Bespoke reviews for tickers of interest to subscribers.

This article was written by

8.16K Followers
I am a retired accountant with a background in large mining projects, from feasibility to full-scale operation, large scale primary industry and food processing, commercialisation of university intellectual property, and consulting to small businesses, government departments and insolvency practitioners. I have gained a wealth of experience from having the extreme good fortune to work, in a cooperative environment, with so many people far more intelligent and smarter than me; from scientists and engineers with MBA qualifications, to University professors across a range of disciplines. Through the accident of mergers, acquisitions and dispositions, I held, at various times, financial controller positions within Utah International Inc, General Electric Inc, and BHP Billiton organizations. If I have a special skill, it is in methods of assessment of projects with long lives, where costs are front loaded and/or future revenues are subject to considerable degrees of uncertainty. In relation to stocks, I have a theory, using projections to calculate a present value per share is far less useful for a share buying decision, than using those same projections for calculating future value per share for determining potential exit value and rate of return.

Analyst’s Disclosure:I/we have no positions in any stocks mentioned, and no plans to initiate any positions within the next 72 hours. I wrote this article myself, and it expresses my own opinions. I am not receiving compensation for it (other than from Seeking Alpha). I have no business relationship with any company whose stock is mentioned in this article.

Disclaimer: The opinions in this document are for informational and educational purposes only and should not be construed as a recommendation to buy or sell the stocks mentioned or to solicit transactions or clients. Past performance of the companies discussed may not continue and the companies may not achieve the earnings growth as predicted. The information in this document is believed to be accurate, but under no circumstances should a person act upon the information contained within. I do not recommend that anyone act upon any investment information without first consulting an investment advisor and/or a tax advisor as to the suitability of such investments for their specific situation. Neither information nor any opinion expressed in this article constitutes a solicitation, an offer, or a recommendation to buy, sell, or dispose of any investment, or to provide any investment advice or service. An opinion in this article can change at any time without notice.

Seeking Alpha's Disclosure: Past performance is no guarantee of future results. No recommendation or advice is being given as to whether any investment is suitable for a particular investor. Any views or opinions expressed above may not reflect those of Seeking Alpha as a whole. Seeking Alpha is not a licensed securities dealer, broker or US investment adviser or investment bank. Our analysts are third party authors that include both professional investors and individual investors who may not be licensed or certified by any institute or regulatory body.

Recommended For You

About GLW Stock

SymbolLast Price% Chg
Market Cap
PE
Yield
Rev Growth (YoY)
Short Interest
Prev. Close
Compare to Peers

More on GLW

Related Stocks

SymbolLast Price% Chg
GLW
--