As you can see in the following chart, the Sprott Junior Gold Miners ETF (NYSEARCA:SGDJ) has started the year off with a somewhat sharp decline after shares touched multi-month highs.
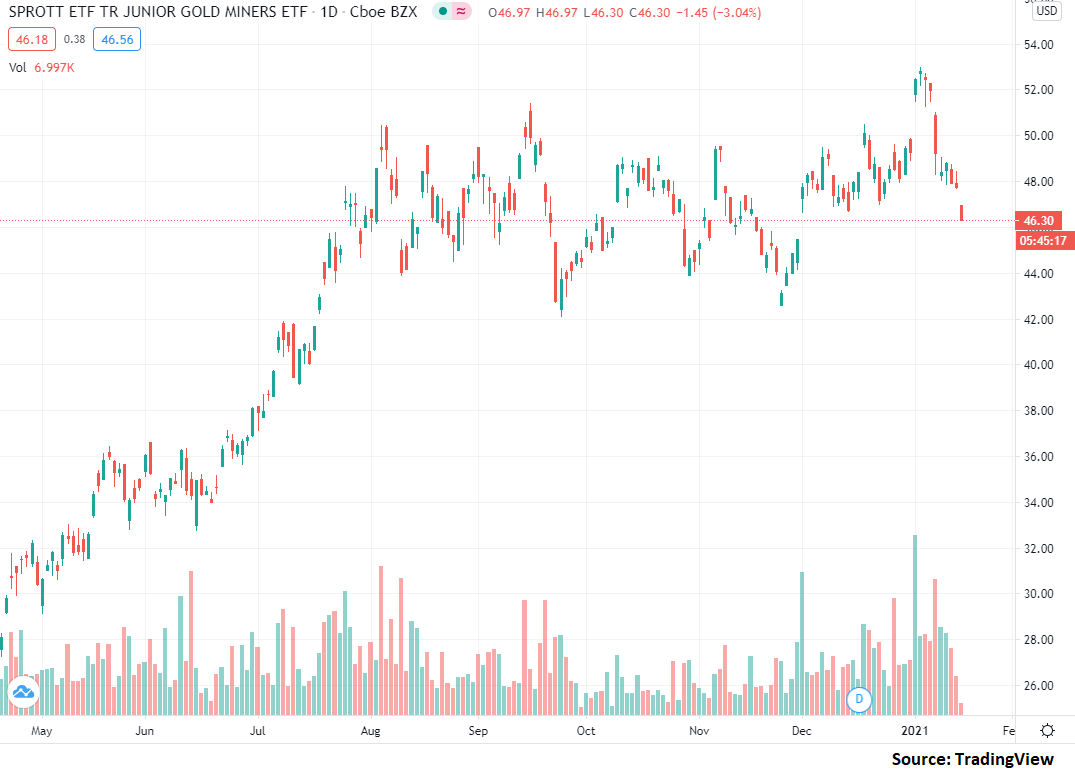
Source: TradingView
At present, I am bullish SGDJ. I believe the ETF is likely going to rally over the coming weeks and that market fundamentals suggest that now is a solid time to own the fund.
About SGDJ
To start this piece off, let's discuss exactly what the scope of the Sprott Junior Gold Miners ETF is and what the fund seeks to do. The ETF is tracking something called Solactive Junior Gold Miners Custom Factors Index which is provided by Solactive. The interesting facet of this index is that it follows a rule-driven fundamental ranking methodology in that firms with strong fundamentals are rewarded and firms with weak fundamentals are penalized in its weighting.
If you'd like to read the fine details of what this index entails, here's the reference document, however the short of it is this:
- All stocks in the index must have a market cap of less than $2 billion
- If a stock is exploring (but not yet producing gold), then its ranking is determined by price momentum
- If a stock is actively producing gold, then its ranking is determined by revenue growth
While this is perhaps one of the more nuanced gold ETPs I've observed, the overall gist of the fund is pretty clear - it targets small cap firms engaged in exploration and production of gold; and it weights these firms based on fundamentals relevant to the lifecycle stage of the firm. And these weights determine the overall weight in the fund. Simple enough.
This said, we have one critical question to ask: to what degree is this ETF correlated with changes in the price of gold? After all, each of the firms included in this index are targeting gold production in some form or fashion which means that an increase in gold prices will likely translate into higher earnings for producers or more price momentum for explorers.
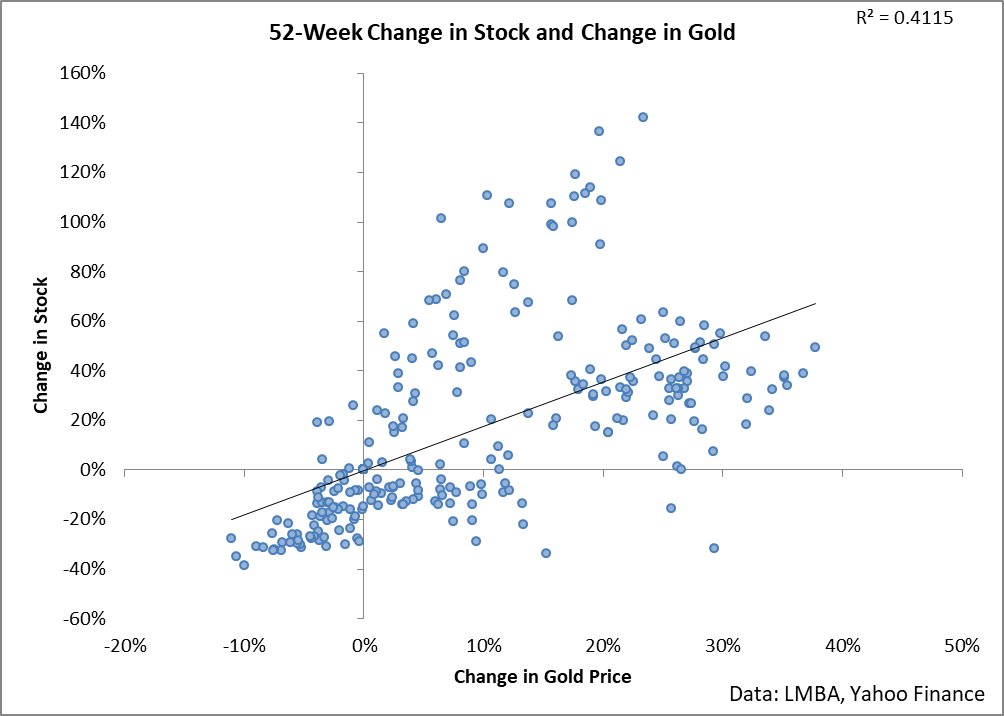
Source: Author's calculations of LMBA and Yahoo Finance data
We are limited somewhat in our dataset in that SGDJ's public data starts in March of 2015. This said however, there is a clear correlation evident in the above chart. As gold's prices increase, so increase the price of SGDJ. We simply don't have enough data to make a firm statement as per historic correlations under certain scenarios (like price rallies or declines), however it appears that there's a relationship developing in that moderate price appreciations in gold (of 10-30%) in a year tend to see outside gains in SGDJ. But we will need a few more years of data to know for certain.
This said, the clear gist of the above data is this: if gold rallies, then SGDJ is likely going to be a strong investment. So let's turn our attention to gold's fundamentals to try and asses where the commodity is likely headed.
Gold Markets
Let's start this section off with a quick glance at the chart.
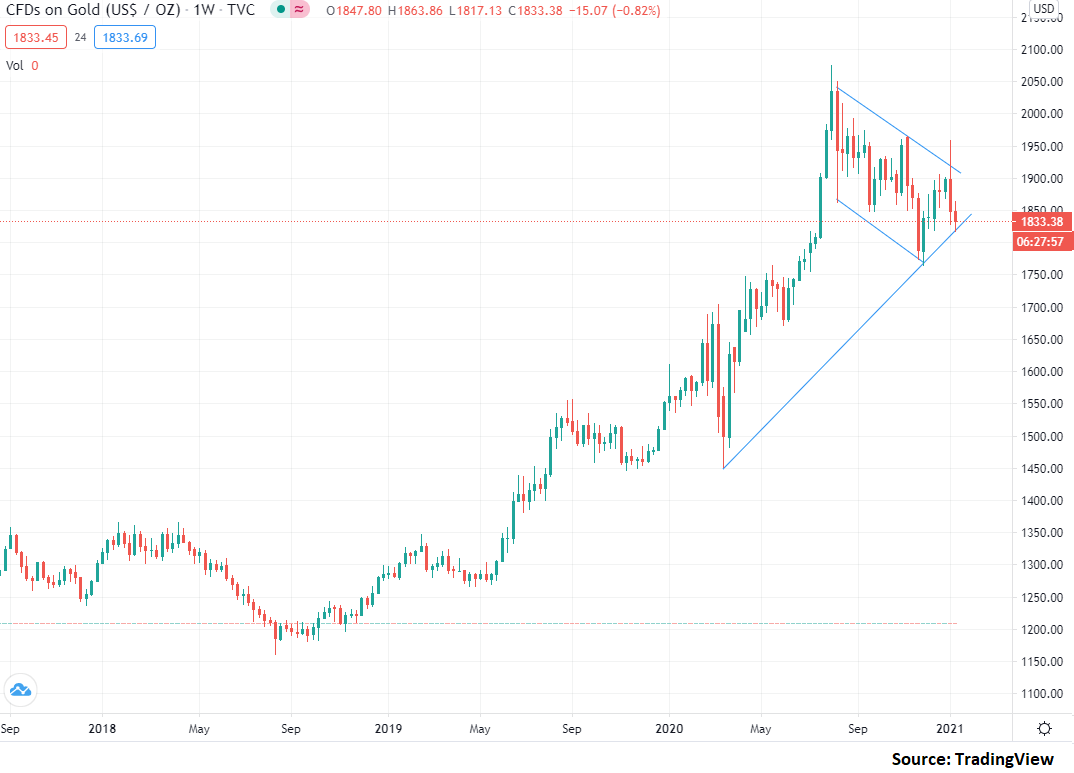
Source: TradingView
As I read the market, gold is currently in a pullback on the weekly chart with prices approaching the ascending trend-line. After hitting a high in September, gold has been unable to make new territory to the upside and we have seen a general reduction in the price of the commodity since.
Based on the above chart, I believe the upwards trend in gold remains intact. However, the critical test of the trend will come within the next month as we see if gold finds support as the ascending trend-line or if the commodity breaks down into further downside momentum. From a technical perspective, if you were interested in using the chart as a reference point for entering a long gold trade, I believe the data current indicates that we should wait and see prior to buying. In other words, give gold 1-4 weeks to see if we get a price rally off of support prior to buying. If we see gold end a week about $1850 per ounce within the next month, then the trend is likely still intact. However, if not then further caution is likely warranted.
While I find some value from technical analysis, most of my focus and research is in medium to long-term fundamental analysis. What I mean by this is that I have found the greatest value through seeking to understand how fundamental catalysts will impact the price of gold and structuring my trades around this information. For example, one of the key catalysts I am monitoring at this point is the ongoing weakness in the dollar.
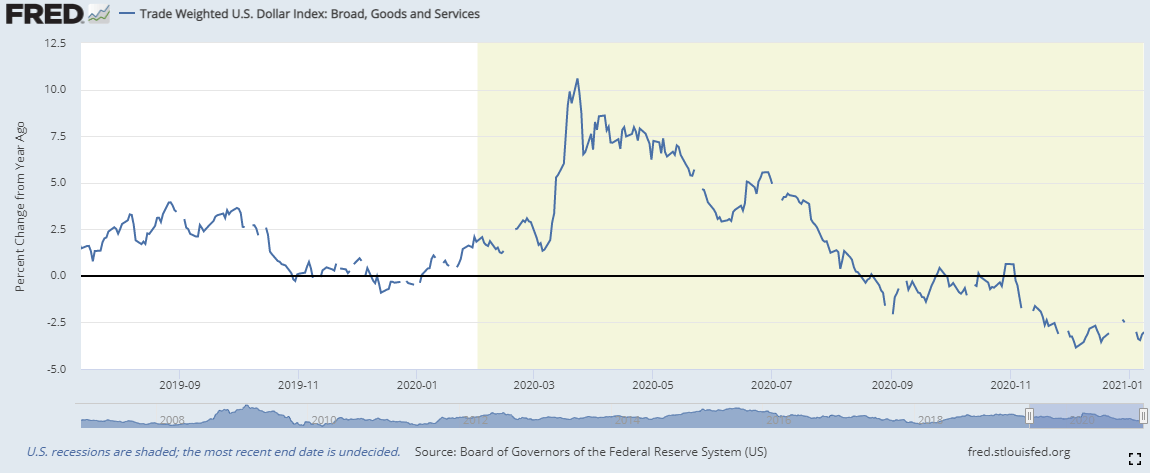
Source: FRED
The above chart shows a rolling 12-month return in the dollar index. What can clearly be seen in the data is that since the epic run-up in the dollar during the market panic of early 2020, we have seen the dollar weaken against other currencies in almost every month.
For gold investors, a weaker dollar tends to be a very good thing - as the dollar weakens, all commodities tend to benefit to a degree. However, there's an interesting facet of the data in that past changes in the dollar tend to actually carry forward into future changes in gold.
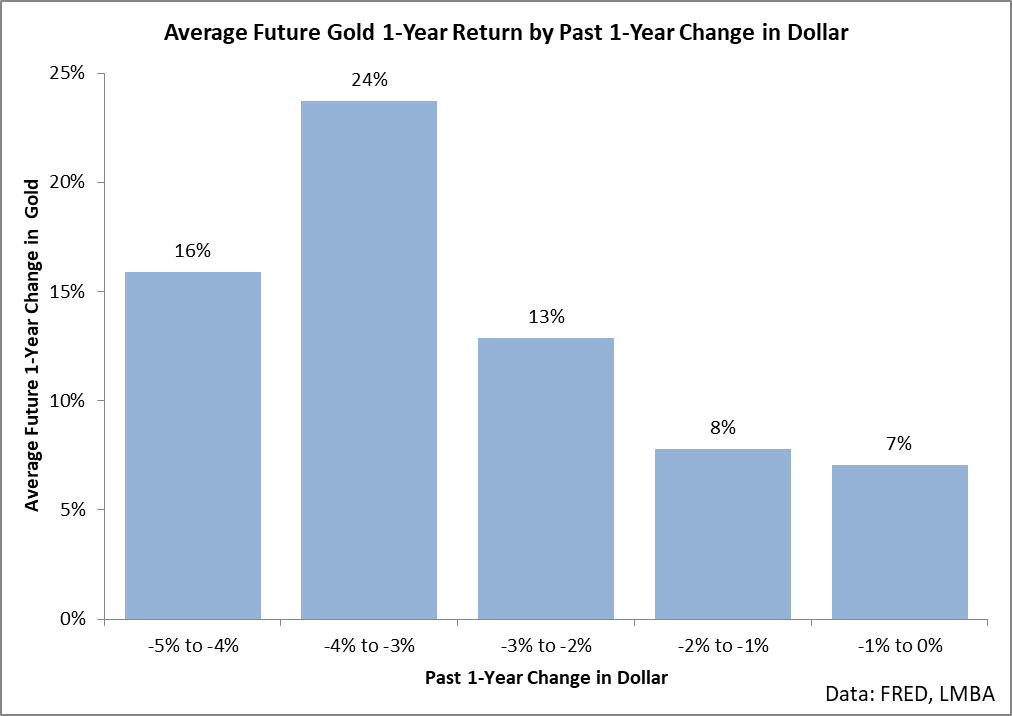
Source: Author's calculations of FRED and LMBA data
In this chart, I have calculated the average further 1-year change in gold given a past 1-year change in the dollar. In other words, this chart helps us understand how gold is likely to perform over the next year based on how the dollar has performed over the past year.
What is clear from the data is that there is a marked relationship: the greater the drop in the dollar, the greater gold tends to rally over the next year, to a degree. What is interesting here is that over the past month, we have seen the dollar's year-over-year declines measure around 3-3.8%. Historically speaking, when the dollar has declined by this amount on a year-over-year basis, it has been very bullish for gold, with the commodity seeing an average move of 24% to the upside following similar changes in the dollar index.
It's important to look deeper than a simple average since it is just a summary figure. When we break the data out into probabilities as well as typical gains and losses following similar dollar movements, the data is actually strongly bullish. For example, when the dollar has declined by around this amount, history shows that gold rallies in 72% of all following years. These rallies average 36% while declines tend to only average 8%. In other words, the data is setting up for a strongly bullish year for gold investors.
Since SGDJ not only correlates to changes in gold but also seems to overstate upside movements, I believe that this is a good time to buy the ETF. However, for the more technically-oriented traders, waiting until gold ends a week above $1850 per ounce is a conservative way to trade the slide in the dollar.
Conclusion
SGDJ is a somewhat complicated ETF which fundamentally weights its holdings and has a history of tracking gold's returns. Dollar weakness is likely to fuel further gains in gold over the next year. The technical picture is somewhat clouded with price at a critical inflection point.